With this ETF surging, here’s the setup to watch
The major indices
reversed early losses to close slightly higher last Friday, but
lower overall volume failed to confirm the rebound. The Nasdaq Composite, S&P
500, and Dow Jones Industrial Average each finished 0.3% higher, but small and
mid-cap stocks maintained their new trend of showing relative weakness. The
Russell 2000 Index closed 0.1% lower, although it recovered from a morning
loss of 1.3%. The mid-cap S&P 400 was unchanged on the day. As it neared our
profit target just below the 50-day moving average, we covered our short
position in OIH (Oil Service HOLDR) last Friday. That “head and shoulders”
chart pattern we shorted netted us a speedy 10-point gain in five days. We do,
however, remain short both
(
MDY |
Quote |
Chart |
News |
PowerRating) and
(
XLU |
Quote |
Chart |
News |
PowerRating).
On the
surface, Friday’s intraday action and modest gains might have looked promising
for the bulls. However, a closer look at what was happening beneath the
surface would reveal a less positive scenario. The biggest negative is that
total volume in the NYSE declined by 6%, while volume in the Nasdaq was 12%
lower than the previous day’s level. This tells us that the reversal attempt
was primarily driven by retail investors as opposed to institutions and
professional traders. Had volume surged higher alongside the gains, it would
have indicated strong demand by mutual and hedge funds, but the obvious
footprint of higher turnover was lacking. Worse is that the lower volume gains
followed the prior session’s “distribution day.” Lackluster market internals
also failed to confirm Friday’s reversal attempt. Despite 0.3% gains in both
the S&P 500 and Dow Jones, declining volume nominally exceeded advancing
volume in the NYSE. In the Nasdaq, advancing volume was only slightly higher.
Throughout
last week, we mentioned on numerous occasions that Semiconductors were the
only industry sector showing any significant strength. While buying some
semiconductor stocks or one of the Semiconductor ETFs is relatively low risk, it doesn’t make sense to buy the only strong sector
while the entire broad market is showing weakness. This is because even
sectors with relative strength will eventually fall apart if the contrary
broad market trend gathers enough momentum. However, remember that many of the
international ETFs trade independently of the U.S. markets, especially those
in emerging markets. One such ETF that may be coming into a buy zone in the
coming week is
(
FXI |
Quote |
Chart |
News |
PowerRating), the iShares ETF that tracks the Xinhua China 25
Index (mainland China’s equivalent of the Dow Jones). We netted a large profit
trading this ETF when it first broke out in the middle of last year, and
bought a similar ETF
(
PGJ |
Quote |
Chart |
News |
PowerRating) when FXI broke out again in January of this
year. Since then, we have been waiting for a price correction that will
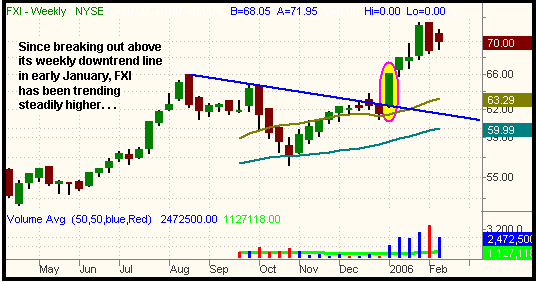
provide us with a low-risk re-entry point on the long side. On the weekly
chart below, notice how FXI surged higher after breaking its weekly downtrend
line in the first week of January:

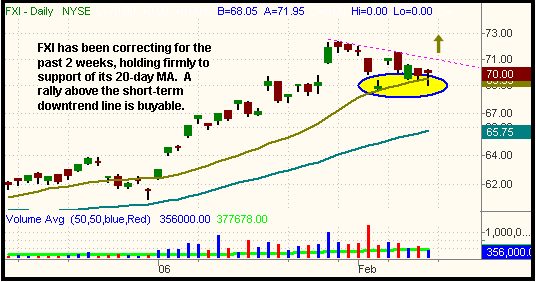
Drilling down
to the shorter-term daily chart, you will see that FXI has been correcting for
the past two weeks, holding support at its 20-day moving average:

In terms of
the proper buy point, we like FXI long if it rallies above its short-term
downtrend line from the January 30 high (the pink dotted line on the chart
above). Regular subscribers should note our trigger, stop, and target prices
below.
The key
resistance levels to watch in the major indices is the February 9 highs.
Unless those highs are violated, we remain bearish and positioned on the short
side in the near-term. For the broad-based ETFs, those resistance levels are:
SPY – 127.60, QQQQ – 41.37, DIA – 109.56, MDY 141.57, IWM – 72.34. You may
want to set alerts on your trading platform to notify you if any of these ETFs
violate those highs. If so, it could indicate a temporary break in the recent
market weakness. The first ETF to rally above that high would also tell you
which stocks are showing the most relative strength. But unless the market
begins to see new sector leadership and retention of gains in the leading
stocks, it seems unlikely the market will rally in a meaningful way. Overhead
resistance of the 20 and 50-day moving averages doesn’t help the bulls either.
Deron Wagner
Deron Wagner is the
head trader of Morpheus Capital Hedge Fund and founder of Morpheus Trading
Group (morpheustrading.com),
which he launched in 2001. Wagner appears on his best-selling video, Sector
Trading Strategies (Marketplace Books, June 2002), and is co-author of both
The Long-Term Day Trader (Career Press, April 2000) and The After-Hours Trader
(McGraw Hill, August 2000). Past television appearances include CNBC, ABC, and
Yahoo! FinanceVision. He is also a frequent guest speaker at various trading
and financial conferences around the world. For a free trial to the full
version of The Wagner Daily or to learn about Deron’s other services, visit
morpheustrading.com or send an e-mail to
deron@morpheustrading.com .
