Buy, sell or hold? These charts can help
How significant the
decline was on Friday depends upon how you are currently positioned,
and, of course, your time horizon. Because I was away from the office on Friday,
I did a quick review Monday morning of the broad indexes.
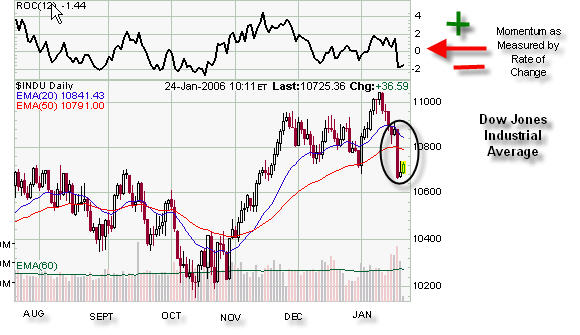
The S&P 500, the Dow Jones Industrial Average,
and the NASDAQ (the big three) all moved underneath their 20-day exponential
moving averages and also closed slightly below their 50-day exponential
averages. Of course, this has relieved the overbought conditions and could
represent a buying opportunity in stocks that fit in to those indexes.
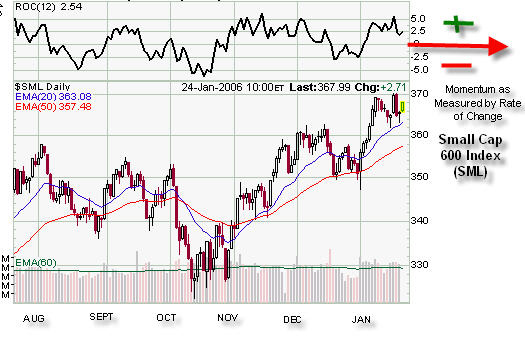
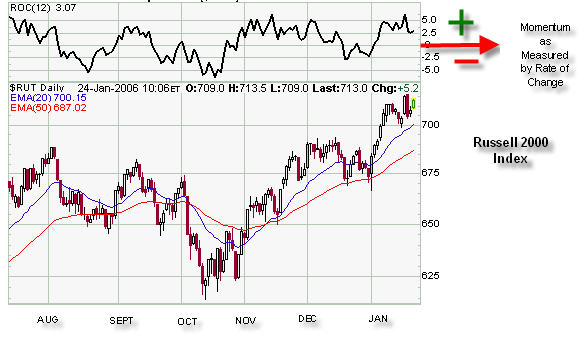
The strong relative indexes, the Russell 2000 and
the S&P 600 Small Cap Index, continue to remain strong. Neither one of those
even broke through their 20-day exponential moving averages, and, their momentum
(rate of change) remains positive. As a matter of fact, even after Friday, as of
Monday morning, the only major index whose momentum has reversed to negative is
that of the Dow Jones Industrial Average.

In order to tell what the damage did to the even
broader market as a whole, I looked at the percent of stocks on the New York
Stock Exchange that are trading beneath their 30-week (150-day) simple moving
average. This intermediate term indicator has reversed to negative, meaning that
6% of the stocks in the universe (NYSE) have moved below their 150-day average.
Which, in and of itself, is of course a negative for the overall market. Also of
note is this index has been making lower highs, which means that, statistically,
it is getting harder and harder to pick winning stocks.

On that note, let’s also review the high low
indicator. The high low indicator measures the number of new stocks making new
highs versus the number of new stocks making new lows (an advance-decline line
of sorts). Using the point and figure method of calculating this indicator, it
has been topping out at around 96, and, before Friday, its’ chart position was
at 92. Friday’s action did not cause the indicator to reverse.

The three questions before us are do we buy, do
we sell, or do we hold? My advice is that if you (still) don’t have enough
allocated towards small and mid-cap, increase that allocation by buying either
the iShares S&P Small Cap 600 Fund
(
IJR |
Quote |
Chart |
News |
PowerRating) or the iShares Russell 2000 Index
Fund
(
IWM |
Quote |
Chart |
News |
PowerRating). Of course, you can do that in a variety of ways, those are just
my suggestions.
As for what to sell, each individual position
that you own would have to be evaluated. I would never advocate the raising of
cash arbitrarily. Have you taken any profits lately? Have any of the stocks that
you own broken down? If the stocks that you own haven’t broken down, and the
sectors and asset classes in which they are a part still look strong, then just
hold them. Friday’s action did not cause enough damage for me to get too
concerned.
Sara Conway
Sara Conway is a
registered representative at a well-known national firm. Her duties
involve managing money for affluent individuals on a discretionary basis.
Currently, she manages about $150 million using various tools of technical
analysis. Mrs. Conway is pursuing her Chartered Market Technician (CMT)
designation and is in the final leg of that pursuit. She uses the Point and
Figure Method as the basis for most of her investment and trading decisions, and
invests based on mostly intermediate and long-term trends. Mrs. Conway
graduated magna cum laude from East Carolina University with a BSBA in finance.
