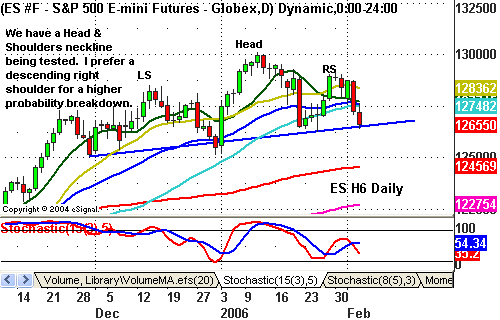
This is why you should be buying weakness and selling strength
The major
indexes gave back a large portion of the previous week’s gains, largely due to
worries over interest rates. While Tuesday’s Fed statement left the door open
for a pause, there was a clear bias towards further tightening. This news
didn’t immediately rattle the equity markets, but equities did experience
further weakness on Thursday and Friday. More than likely, it took market
players some time to figure out that the macro conditions weren’t lining up
properly for the Fed to stop tightening. The Energy space was the weakest
group, while relative strength was seen in Transportation names.
While
many simply can’t stand to see equities decline, it was normal to see some
weakness given how well stocks have acted recently. This is especially true in
light of the uncertainty over when the Fed may stop raising rates. Many
positive factors continue to line up, which could be setting the stage for a
powerful move to the upside. However, without cooperation from the Fed, and
soon, the bullish factors could likely be negated to a large degree. With that
said, I continue to believe that near-term market direction will unfortunately
be range-bound.
More than
likely, a game of tug-of-war between slowing economic/earnings growth and the
possibility of the Fed stopping will continue. After the earnings reports and
economic data seen over the past 3 weeks, there is little question that the
economy is slowing down. Nonetheless, as long as market players are expecting
the Fed to stop raising interest rates, I would guess that the downside will
likely remain somewhat contained as we move forward. At the same time, without
any clear indication that the Fed will halt their tightening cycle, it will
probably prove to be very difficult for the market to break out all that much on
the upside. Consequently, the ideal trading strategy is to buy weakness and
sell/short strength. Eventually this will change, and as I said last week,
Bernanke may have been waiting for Greenspan to be gone before he inserts his
own bias into the mix. But, with the next Fed meeting still 2 months away,
we’ve got some waiting to do

Daily Pivots for 2-6-06
| Symbol | Pivot | R1 | R2 | R3 | S1 | S2 | S3 |
| INDU | 10812.09 | 10845.11 | 10896.61 | 10929.63 | 10760.59 | 10727.57 | 10676.07 |
| SPX | 1265.31 | 1269.59 | 1275.16 | 1279.44 | 1259.74 | 1255.46 | 1249.89 |
| ES H6 | 1268.50 | 1273.50 | 1281.50 | 1286.50 | 1260.50 | 1255.50 | 1247.50 |
| SP H6 | 1267.77 | 1271.73 | 1277.97 | 1281.93 | 1261.53 | 1257.57 | 1251.33 |
| YM H6 | 10829.00 | 10868.00 | 10935.00 | 10974.00 | 10762.00 | 10723.00 | 10656.00 |
| BKX | 101.91 | 102.58 | 103.37 | 104.04 | 101.12 | 100.45 | 99.66 |
| SOX | 531.29 | 534.07 | 539.37 | 542.15 | 525.99 | 523.21 | 517.91 |
Please feel free to email me with any questions
you might have, and have a great trading week!
Chris Curran
Chris Curran started his trading career at the age of 22 with a national
brokerage firm. He combines fundamentals and technicals to get the big picture
on the market. Chris has been trading for 15 years, starting full time in 1997,
and has never had a losing year as a full-time trader.
