Here’s What To Watch This Week
The major indexes finally recorded their first winning
week of 2005, as equities were able to squeak out minor gains.Â
Things started off on a negative note Monday with stocks suffering sharp
declines. However, the selling pressure exhausted itself by Tuesday, which gave
way to solid gains mid-week. Thursday and Friday did bring back the sellers, as
stocks were not able to capitalize on further solid earnings. Market pundits
cited worries over the Iraqi election for the weakness late in the week. The
only problem with this assessment was the fact that Crude Oil prices actually
posted a sharp decline on Friday, which doesn’t usually happen if market players
are nervous over events in the Middle East. On a positive note, market
internals did improve quite a bit from what had been seen so far this year.
The March
SP 500 futures closed out the week with a gain of +6.25 points, while the Dow
futures added +54 points. On a weekly basis, the ES is still holding its
bearish Butterfly pattern, but is possibly forming a bull flag, as it posted a
market structure low off of its 38% Fib retracement of the Oct-Dec up move. On
a daily basis, the contract posted a doji and still remains in a bear flag under
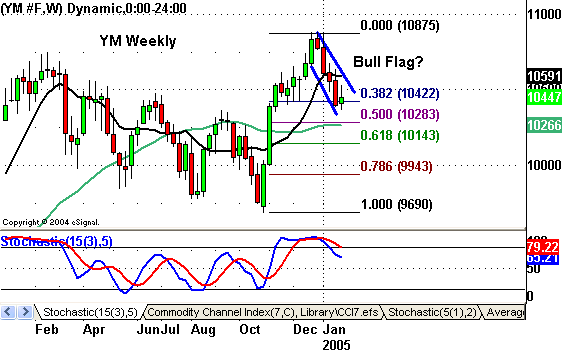
its 10-day MA. The YM is also forming a bull flag as it posted a market
structure low off of the 38% Fib retracement of its Oct-Dec up move, and a daily
hammer just under its 10-day MA. For you daily 3-Line Break followers, the YM
and ES remain short with Break Prices of 10502 and 1178 respectively. The ER2
is also holding its weekly Butterfly pattern and posted a spinning top,
reflecting indecision, at its 50% Fib retracement of the Oct-Dec up move. Â
Â
               
The U.S. Dollar remains trapped
in a range, but continues to find a floor off of its 10-day MA, while the 10-yr
Note (ZN) continues to form both weekly and daily Symmetrical Triangles. The
Banking Index (BKX) is testing the lower end of its weekly up channel while its
10-day MA continues to provide hard resistance. The Semiconductor Index (SOX)
posted a market structure high off of its weekly Bear Flag, after earlier
breaking to a new weekly low.
Â
The issue
that I touched on last week, specifically mutual fund outflows in January,
continued, as U.S. equity funds posted a net outflow of $2.7 billion for the
week. These outflows are what likely played a large role in equities’ inability
to hold most of their gains seen mid-week. And as long as this trend continues,
it could be very difficult to for the major indexes to achieve any type of
sustainable rally. The overall tone of earnings and guidance season has been
positive. Nonetheless, when money is being pulled out of funds at the current
rapid pace, the selling often trumps all other market news.Â
Â
Looking
ahead this week, earnings season begins to wind down as more of the “secondary”
companies will be reporting. However, the market will have a lot of economic
reports to digest (or choke back up), starting with the Chicago PMI on Monday,
the ISM Index on Tuesday, a 2-day FOMC meeting concluding on Wednesday, and the
January Employment report on Friday.
Â
 Â
Â
Please feel free to email me with any questions
you might have, and have a great trading week!
Â
Â
Â
Â
