I See This Trend Continuing Near-Term
After enduring modest declines over the first 2 days of
the week, equities rocketed higher on Wednesday, and posted yet
another bullish week of trading. The remainder of the week was spent in a
healthy consolidation of the gains. These gains came despite mixed economic
data, which went a long way towards questioning the sustainability of an
economic recovery. On a positive note, Semiconductor bellwether Intel issued a
very upbeat mid-quarter update. This news was a catalyst for technology shares
to outperform, as many market players become optimistic that the inventory
problems in the Chip sector may be coming to an end. Market internals also
remained favorable, which confirmed the price action.
The
December SP 500 futures closed out the week with a gain of +8.50 points, while
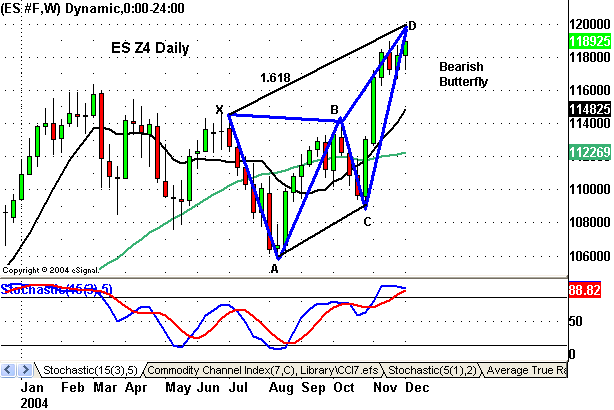
the Dow futures tacked on +71 points. On a weekly basis, the ES broke the 11/19
weekly high, but stalled again at the 1.618 extension on another bearish
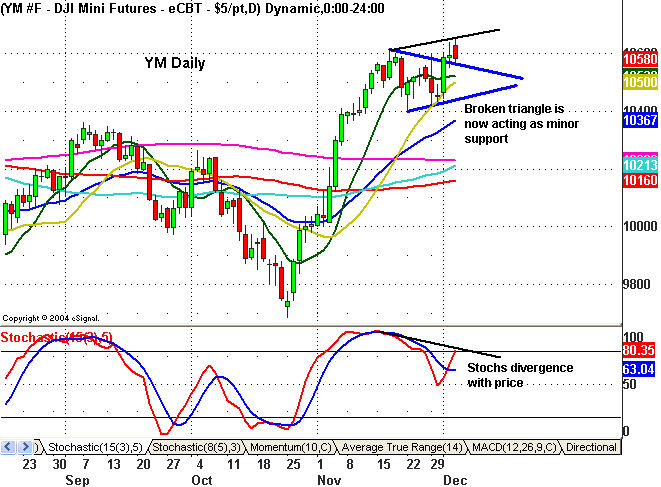
Butterfly pattern. Looking at the daily chart, the ES posted a market structure
high and a doji to follow Thursday’s gravestone, but is still holding above its
broken triangle line.  The YM posted a market structure high and a key reversal
with bearish divergence, but bounced off of its broken triangle line as
support. For you daily 3-Line Break followers, the YM Break Price remains at
10451, while the ES Break Price remains at 1186. In the small caps, the ER2
closed at a new weekly high, but posted a 2nd daily gravestone in a row on top
of bearish Stochs divergence.
                   
Â
                   
The U.S.
Dollar negated Thursday’s reversal to post a bearish engulfing line and close at
the week’s low. A close back above its 20-day MA at 83.46 is needed to signal
any type of short-term bottom. The 10-yr note (ZN) posted a weekly hammer and
closed at the week’s high with a daily market structure low just under its
10-day MA. The Semiconductor Index (SOX) stalled at its 50% Fib retracement of
this year’s slide.
The market
action over the past 2 weeks has been very indicative of historical seasonal
patterns. Once mutual fund tax loss selling concluded in late October, stocks
started moving higher and have continued to climb higher since then. Every
pullback in stocks has been minor, as a clear bid has been underneath this
market. Also, fund managers are likely feeling more pressure each day to commit
their spare cash, due to fears of underperforming their benchmarks.Â
Meanwhile,
as we saw with Friday’s Jobs report and the Consumer Confidence data earlier in
week, the economic data remains far from rosy. Nonetheless, seasonal factors
have easily trumped economics, and barring any catastrophic and/or unexpected
event, or huge spate of individual tax loss selling, I would expect this trend
to continue over the near- term.Â
The economic calendar is pretty
light this week, with the only big report being the November PPI on Thursday.Â
All eyes will be on Wednesday’s API numbers after Crude Oil prices tanked last
week on the news of the higher-than-expected build in supplies.Â
Also, Thursday is rollover day
for stock index futures, with March ’05 (symbol H5) becoming the lead month.
 
Â
Please feel free to email me with any questions
you might have, and have a great trading week!
