Month End: Generals Taking Care Of Business
Kevin Haggerty was the former head of trading for
Fidelity Capital Markets. His column is intended for more advanced traders. If
you would like to learn how Kevin trades,
you can find more information here.
The SPX
(
.SP500 |
Quote |
Chart |
News |
PowerRating) contracted volatility
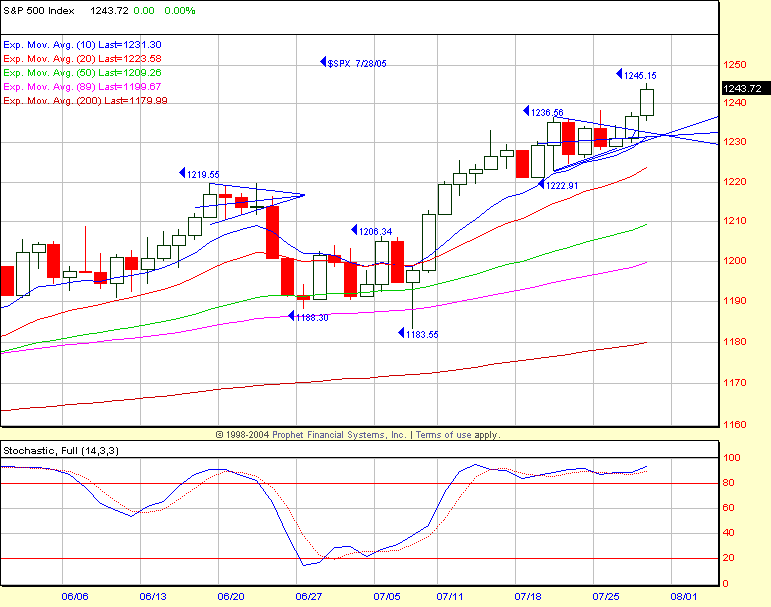
pattern that formed 13 days off the 1183.55 London low broke out to the upside
on 07/27/05 (Wednesday), which is also a Fib time ratio. There was continuation
yesterday to a 1245.15 intraday high, closing at 1243.72, as did the Dow
(
$INDU |
Quote |
Chart |
News |
PowerRating) to 10,706, the Nasdaq
(
$COMPQ |
Quote |
Chart |
News |
PowerRating) to 2198, while the
(
QQQQ |
Quote |
Chart |
News |
PowerRating) was +0.5% to 39.91. Friday is month-end and then maybe some new
August monies. This was a high-probability play as I outlined in the 07/27/05
commentary, which you should read again for clarification. It was an excellent
spot for the straddle which was adjusted on the initial breakout which made the
trade 2:1 long. The nice thing is that it broke out the day after it was put on,
but as some of you
sequence traders know, things happen around key times,
especially when the primary tools are in play.
NYSE volume expanded some to 1.55 billion shares,
not unexpected coming into month-end. The volume ratio was very positive at 73,
as was breadth at +1567. The
(
SMH |
Quote |
Chart |
News |
PowerRating), +0.2%, BKX, +0.1%, PPH, +0.3%, and the
(
OIH |
Quote |
Chart |
News |
PowerRating) all underperformed the SPX, while $TRAN was +1.5% and XLB +1.1%.
(
PX |
Quote |
Chart |
News |
PowerRating), +3.8%,
(
APD |
Quote |
Chart |
News |
PowerRating), +1.8%, and
(
DOW |
Quote |
Chart |
News |
PowerRating), +1.7%, led the XLB. It didn’t
hurt these stocks that the
(
TLT |
Quote |
Chart |
News |
PowerRating) was +0.9%. You know, the Greenspan dilemma:
economy moving forward, short rates up and long rates down. This TLT gain sent
the housing index ($HGX) up +2.4% to 596 and a new high above 583.35 on
07/20/05. It looks like it is on its way to a mini-dot-com air pocket. That
doesn’t mean run out and short it because many tried that with the dot-com
bubble and got carried out as very unhappy campers. There will be good position
short-side opportunities (puts) when there is a definite change in direction
(daily charts). The $HGX is +30% in 52 days from the 05/13 low and is at the top
of a rising channel, so daytraders that trade a stock or two from this group
both ways every day might catch some quick downside price drops from this upper
channel zone. However, if it is not one of your core stocks, stay away from the
intraday short side because these stocks are obviously strong momentum ATL
(“Above the Line”) stocks.
Crude oil, which the media forgets when stocks
rise at the same time, was +1.4% to 59.94, but the Generals could care less when
they are taking care of business at month-end and maybe the first few days of
the new month.
Have a good trading day,
Kevin Haggerty
P.S. I will be
referring to some charts at
www.thechartstore.com in the future.

