Programs control market action into Friday
Kevin Haggerty is
the former head of trading for Fidelity Capital Markets. His column is
intended for more advanced traders. Kevin has trained thousands of traders
over the past decade. If you would like to be trained by him,
ext. 1
The SPX
(
SPX |
Quote |
Chart |
News |
PowerRating) has retraced to the 20-day EMA
of 1227.16 with yesterday’s 1226.16 intraday low. It closed at 1227.16, which is
also just below the fourth weekly retracement-bar high of 1227.29 (see your
weekly chart). This level is also the .382 retracement to the 1201.06 08/30 low.
The next two levels of interest for daytraders below are 1222.10 and 1217.
Expiration is Friday, and this Fib time week has been a quick reversal from the
1243.13 high last Friday (09/09/05). However, the Generals will make every
attempt to mark prices up, if they can, at the end of this quarter, so any
further short-term decline is beneficial for traders and could set up some
short-term reflex up.
NYSE volume was 1.48 billion shares, the volume
ratio 41 and breadth -822. Another down day today will push the 4 MAs of volume
ratio and breadth to the beginning of the short-term oversold zone, and on the
daily chart, the 5 RSI is only 44, so the SPX is not in our trader friendly zone
yet. The Dow went out at 10,545, -0.5%, the
(
QQQQ |
Quote |
Chart |
News |
PowerRating) -1.1% to 39.18 and the
Nasdaq
(
COMPQ |
Quote |
Chart |
News |
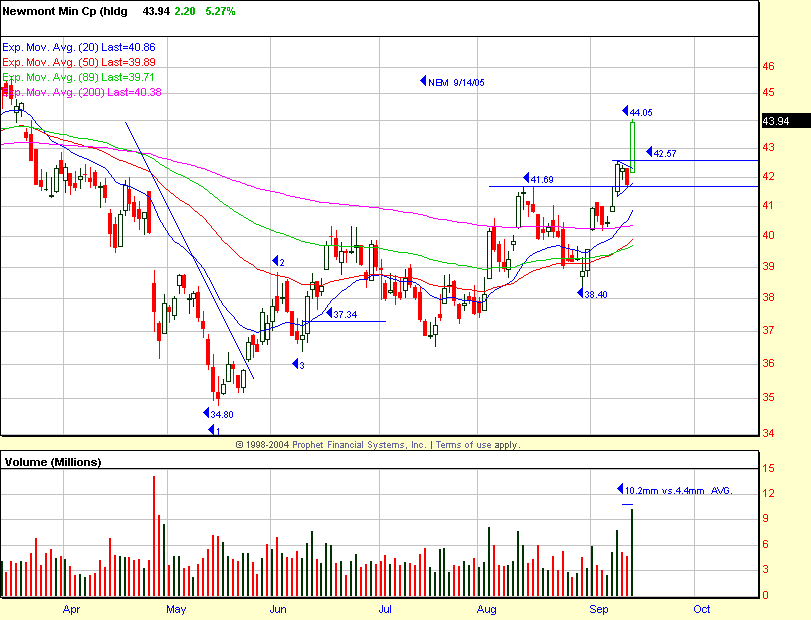
PowerRating) -1.0%. In the sectors it was all about gold and energy with
our core gold stock
(
NEM |
Quote |
Chart |
News |
PowerRating) +5.3% having broken out of a Dynamite Triangle
yesterday to a 44.05 intraday high and 43.94 close. The 1,2,3 HB (Higher Bottom)
entry above 37.34 is still intact (see chart). Yesterday’s five-minute chart
entry was from a
Slim Jim above 42.80 which ran +2.9% from entry to 44.05. That
is only if you did not take the daily chart breakout of the contracted
volatility pattern. The remaining primary sectors were red, led by the RTH,
-1.1%, and
(
SMH |
Quote |
Chart |
News |
PowerRating), -0.7%. The
(
TLT |
Quote |
Chart |
News |
PowerRating) continues to be a beach ball and was
-0.4% yesterday.
RST traders had a long entry yesterday above
1231.84, but could not get past 1234.40 before heading south to the 1220.16
close. The exit below 1233 put price below all of its five-minute-chart EMAs.
Expiration programs can make you feel “trading
inadequate,” so don’t get cerebral today and Friday.
Have a good trading day,
Kevin Haggerty

