Do you like to trade big moves? Learn how from these two charts
RISK EQUALIZATION
In the quest for trading success many traders are
seduced into a fruitless search for a perfect entry or exit technique. While
they hunt in vain, they miss some very simple strategies that enhance trading
returns yet do not involve entry or exit. One strategy most traders overlook
altogether is risk equalization. Risk equalization allows a speculator to make
proportional adjustments to their account while staying in their tolerance for
risk.
Risk equalization means you adjust the number of
contracts or shares to stay within pre-determined risk guidelines. For instance,
a trader wouldn’t trade a Corn futures contract the same as he would trade an
S&P 500 futures contract. The two contracts are dissimilar in size and move
differently.
Frequently however, traders get a ‘lot size’
mentality. They are comfortable trading one contract of many markets, but get
skittish at the possibility of having 10 contracts on one instrument and 2 on
another. Many traders become anxious if they have different contract sizes in
different markets.
If you suffer from this anxiety don’t let it get
you down. I’ve seen professional and seasoned traders get caught in this trap.
Here’s an example: I personally witnessed one trading program that did not risk
equalize their portfolio. During 2003 this program returned north of 40%. Money
under management quickly blossomed from less than a million dollars to over $20
million in just a -month period. All indications pointed to a very promising
future.
Early in 2004 I noticed they were trading one CME
Eurodollar contract and one CBOT Ten Year Note contract concurrently. A trader
with just a few months of experience realizes, in terms of risk, one Eurodollar
is not equal to a single Ten Year Note contract. In comparison with the Ten Year
Note, Eurodollars typically have a smaller margin requirement and smaller daily
fluctuation. The trade ended with Eurodollars up and Ten Year Notes down. Since
risk was not equalized, the two positions netted a loss. If risk had been
equalized then the trades would have netted to nearly break even. This program
ended 2004 down more than 50% and their assets under management quickly dwindled
back to a few million dollars. I firmly believe inadequate risk management,
specifically risk equalization, shortened the life of their program.
There are several methods you can use to equalize
risk on your own. For example, what if you’re a futures trader? Futures traders
have a distinct advantage due to margin. Exchanges and brokerage firms factor in
market volatility to set margin requirements. Simply stated, markets with high
margin have a larger daily monetary fluctuation than those with a low margin
requirement. A market with a $500 margin requirement will move slower than a
market with a $5,000 margin requirement.
Recall the Eurodollar/Ten Year Note example.
Typically CME Eurodollars have a margin requirement of $400 and CBOT Ten Year
Notes’ margin is around $1,200. You can quickly see it takes 3 contracts of
Eurodollars to equal one contract of Ten Year Notes.
Another method of risk control involves measuring
the risk you want to take on each trade or fixed fractional trading. Fixed
fractional trading simply means you trade the same percent of your account on
each trade. For instance 5% risk per trade on a $25,000 account means you use a
maximum of $1,250 per trade.
| Account Size: $25,000 |
Maximum Trade Risk: 5% – |
||
|
|
Stop in terms of dollars |
Contracts to Trade |
Risk in Dollars |
|
|
$400 |
3 |
$1,200 |
|
|
$500 |
2 |
$1,000 |
|
Ten |
$1,000 |
1 |
$1,000 |
|
|
$800 |
1 |
$800 |
As the account increases in value so does the
risk per trade. At $35,000 5% risk per trade equates to $1,750.
| Account Size: $35,000 |
Maximum Trade Risk: 5% |
||
|
|
Stop in terms of dollars |
Contracts to Trade |
Risk in Dollars |
|
|
$400 |
4 |
$1,600 |
|
|
$500 |
3 |
$1,500 |
|
Ten |
$1,000 |
1 |
$1,000 |
|
|
$800 |
2 |
$1,600 |
Risk for each market does not exceed 5% of the
total account size in either example. Your personal situation may be different,
but the math works the same. The risk in dollars fluctuates as the account
increases or decreases in size; however risk is always contained to a fixed
percent per trade.
This method is versatile enough to accommodate
stock traders. Your monetary risk is the distance between entry price and the
stop setting. For example: if you own a stock at $50.00 per share and use a stop
of $46.00 then monetary risk is $4.00. If you wanted a maximum risk of $1,250
then divide $1,250 by $4.00 to get the number of shares, or 312 for this
example.
Implementing this type of risk control allows you
to take advantage of your trading capital without becoming over extended on one
trade. Both novices and veterans fight the temptation to become married to one
trade. This temptation can force you to take a larger position because you feel
a trade will work out regardless of short-term fluctuations. Most times the
trade never works out as expected and losses mount, the unenviable position of
most investors who simply buy and hold. You may even be forced into retirement
with extreme losses. Having a clearly structured money management scheme that
you adhere to allows you to promptly size up risk and control it.
Manage risk or it will manage you. Don’t be a
trader who is afraid to take bigger positions in smaller markets. Subscribe
yourself to the old trading axiom, trade all markets equally and equally trade
all markets.
TREND FOLLOWING EXAMPLES
One noteworthy trend follower has long said that
trend following has the uncanny ability to take advantage of global events. In
other words trends occur where there is uncertainty. Two recent and dynamic
illustrations of this point are Natural Gas and Delta Airlines
(
DAL |
Quote |
Chart |
News |
PowerRating).

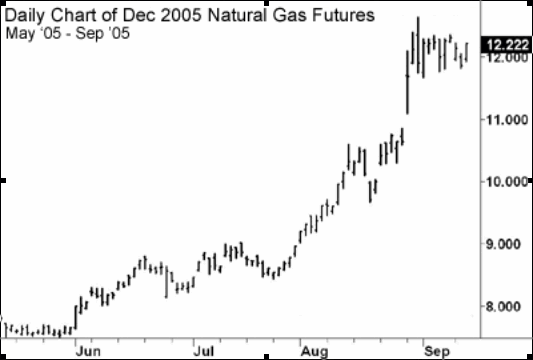
Hurricane Katrina tore up natural gas production
in the Gulf of Mexico. However Natural Gas was moving up prior to hurricane
fears. In fact Natural Gas was advancing from 8.000 up to 9.000 a month before
the hurricane. When the hurricane hit it propelled the market to 12.000, or a
move of 50% from its June price.

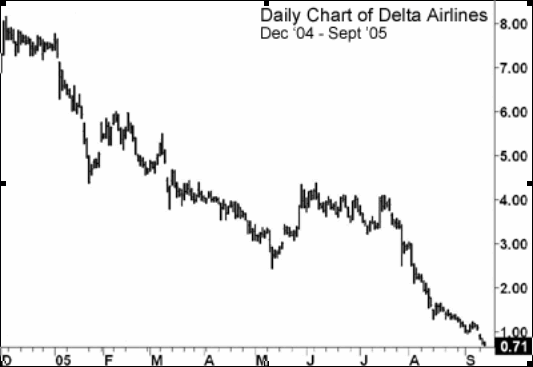
After the close on September 14th Delta Airlines
filed for bankruptcy. We all knew the airlines were in trouble, but no one knew
it was this bad, or did they? You can see a very well established down trend in
place through most of 2005. The trend confirmed problems at the airline long
before bankruptcy was announced (not unlike the Enron example in my book Trend
Following).
Both of these charts demonstrate one powerful
insight: just trade the trend, forget about the fundamental noise everywhere.
Natural Gas and Delta were well on their way to big trends a long time before
the public realized what was going on. If you waited for some kind of trend
confirmation through a study of fundamentals, then you bought the high of
Natural Gas and sold short the low of Delta. In the case of Delta, you missed
the entire trade altogether.
Michael Covel
Michael W. Covel is the founder and President
of Trend Followingâ”
