Contracted Volatility Precedes Price Moves
The SPX
(
$SPX.X |
Quote |
Chart |
News |
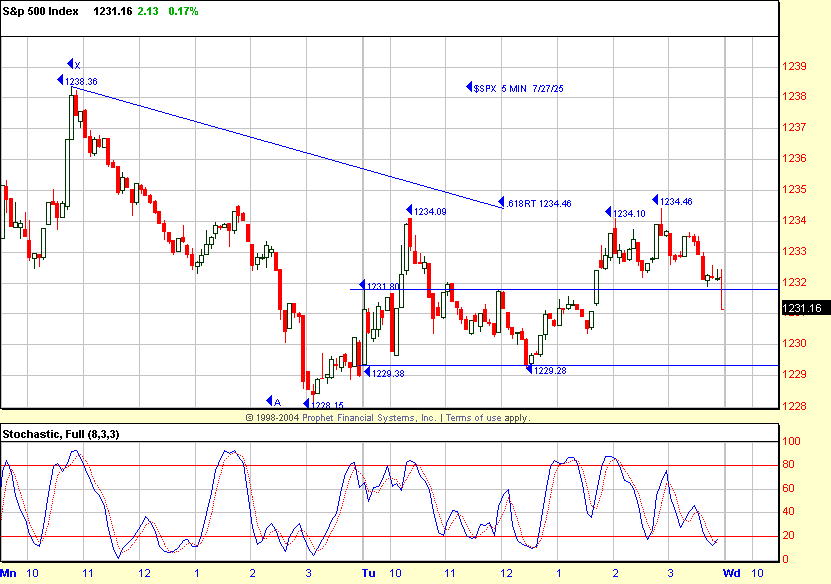
PowerRating) had an opening range of
1231.80 – 1229.38 until a brief breakout to 1234.09 on the 10:10 a.m. ET bar
which failed at 1234.09 after just two bars. Next, the attempt was made to take
out the range low of 1229.38, which it did by a few ticks to 1229.28. That
didn’t bring in any selling, so it reversed up to 1234.46 by 2:50 p.m. before
fading to close back into that opening Flip Top range at 1231.16, +0.2% on the
day. The futures probes in either direction failed to generate any intraday
trend. If you took the initial Flip Top entry to 1234.09, you made small or
scratched your trade, but if you took the reversal of the 1229.38 low to the
upside, you made a few points. Not a great trading day for the SPX. The Dow
(
$INDU |
Quote |
Chart |
News |
PowerRating) was -0.2% to 10,580, led by
(
DD |
Quote |
Chart |
News |
PowerRating), -6.6% (earnings). This
carried over to the XLB (basic materials), -1.4%, with other basic stocks like
(
PX |
Quote |
Chart |
News |
PowerRating) -2.2%,
(
DOW |
Quote |
Chart |
News |
PowerRating) -1.9% and
(
APD |
Quote |
Chart |
News |
PowerRating) -1.8% all following the DD news. On
the other hand, the
(
QQQQ |
Quote |
Chart |
News |
PowerRating) was +0.4%, led primarily by the semiconductors,
with the
(
SMH |
Quote |
Chart |
News |
PowerRating) +2.0% bolstered by
(
TXN |
Quote |
Chart |
News |
PowerRating), +5.0% (earnings news). TXN had
a big opening gap up from a 30.60 previous close to 31.94 and only hitting 31.61
on the second five-minute bar, which was the intraday low. The Nasdaq
(
$COMPQ |
Quote |
Chart |
News |
PowerRating) was also +0.4% to 2176.
NYSE volume expanded a bit to 1.47 billion shares
with the volume ratio 58 and breadth +539. The 4 MA of the volume ratio at 46
and 4 MA of breadth -88 highlight the recent SPX choppy range price action,
mostly knee jerk reactions to announced news.
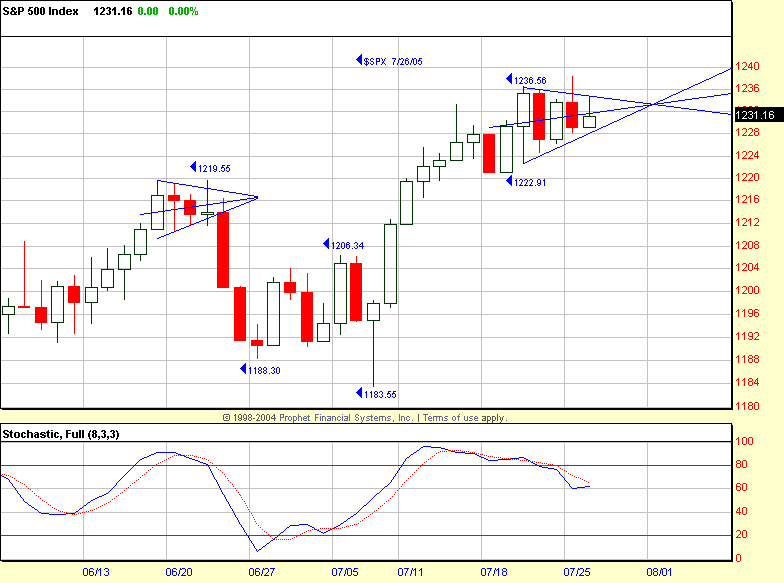
The SPX is in a contracted volatility pattern for
the past five days which will be resolved quickly. A short-term straddle was
bought to play the resolution of this pattern. This method and the straddle
adjustment is explained in the seminar material. The implied volatility is very
low, and there is month-end trading through Friday, then any new August monies.
If it goes positive, the first upside magnet is 1254. If not, this rally from
the 1183.55 low is 13 days old, and things happen around Fibonacci numbers. The
SPX is 67 days off the 04/20/05 1136.15 low, so any downside retracement of
significance would not be a surprise, especially in light of the current
terrorist situation, i.e., it is a high-probability play, and I don’t care which
direction it goes.
Have a good trading day,
Kevin Haggerty
P.S. I will be referring to some charts at www.thechartstore.com in the future.


