Anticipate Your Next Key Zone
The SPX
(
$SPX.X |
Quote |
Chart |
News |
PowerRating) continues to play musical
chairs with a -0.4% close yesterday to 1229.03. Last week it was -0.6%, +0.7%,
+0.5%, -0.7% and +0.5% on Friday prior to yesterday’s -0.4%. This has not been a
position trader’s ideal situation as the swings shake you out. The only real
thread has been energy’s sharp upside move, including yesterday’s
(
OIH |
Quote |
Chart |
News |
PowerRating)
+1.2% close following last week’s +5.6% gain. The Dow
(
$INDU |
Quote |
Chart |
News |
PowerRating) was -0.5% to
10,596, the
(
QQQQ |
Quote |
Chart |
News |
PowerRating) -0.4% to 39.27 and Nasdaq
(
$COMPQ |
Quote |
Chart |
News |
PowerRating) -0.6% to 2167.
The Dow Transportation index ($TRAN) was -1.3%. NYSE volume was 1.3 billion
shares, the volume ratio 34 and breadth -838. The only primary sector SPDR to
close green was the XLE (+0.9%). The XAU, -1.2%, and XLB, -0.8%, led the sector
downside. Many of the focus list energy stocks continue to make new 52-week
highs as this sector has been a daytrading goldmine after any and all
retracements.
The XLB (basic materials SPDR) has been locked in
a range from 29.10 – 26.70 since 04/14/05, closing yesterday at 28.53. This
range keeps reversing the 200-day EMA, which is now 28.23 vs. yesterday’s 28.53
close. The three highs of this range are 29, 29.10 and yesterday’s 28.97 vs. the
double 26.70 bottom. This is a chart picture that will take on meaning depending
on the directional resolution. Both the $TRAN and XLI (industrial SPDR) have
broken their downside channels from the March highs. After all the economic and
earnings hoopla hyped by the media, the major indices are still nowhere relative
to their 12/31/04 closing prices. The SPX is +1.4% vs. its 12/31/04 close of
1211.92, while the Dow, QQQQ and Nasdaq remain below their 2004 closing prices
of 10,783, 39.92 and 2175.44.
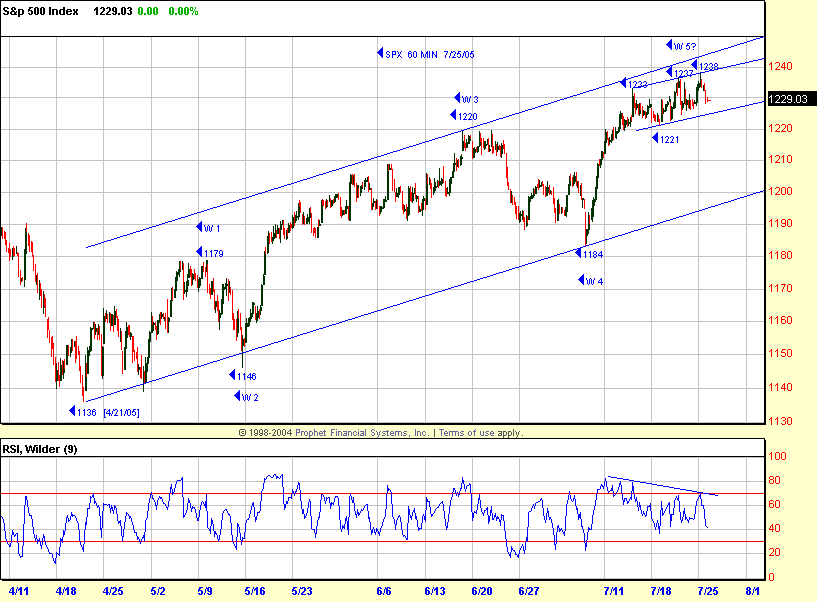
The current 60-minute chart in today’s commentary
highlights the current RSI 9 negative divergence and three higher drives to
1238. This is the fifth leg of the rally off the 1136 low and also the fifth
wave off the 769 October 2002 low. The most frequent fifth wave measurement for
the fifth wave would be 1305. You measure the 769 low to the wave 3 high of
1163, then times it by .618 and add the result to the wave 4 low of 1061 which
measures to the 1305 level. I consider the initial part of that zone to be 1254,
which is the .618 retracement to 1553 (March 2000 high) from 769 (2002 low). The
2.618 Fibonacci extension of the wave 1 leg measured from the wave 2 low of 789
is 1273, so that gives you some frame of reference for the next high-probability
reversal zone.
Have a good trading day,
Kevin Haggerty
P.S. I will be
referring to some charts at
www.thechartstore.com in the future.

