Don’t Chase The London Price Action–Let It Come To You
The London rally/PPT manipulation continued on
Friday, taking the SPX
(
$SPX.X |
Quote |
Chart |
News |
PowerRating) to a 1211.86 close, +1.2% and +1.6% on
the week, which was essentially the gains on Thursday and Friday. The Dow
(
$INDU |
Quote |
Chart |
News |
PowerRating)
was +1.4% Friday to 10,448, which was also the gain for the week. The
(
QQQQ |
Quote |
Chart |
News |
PowerRating),
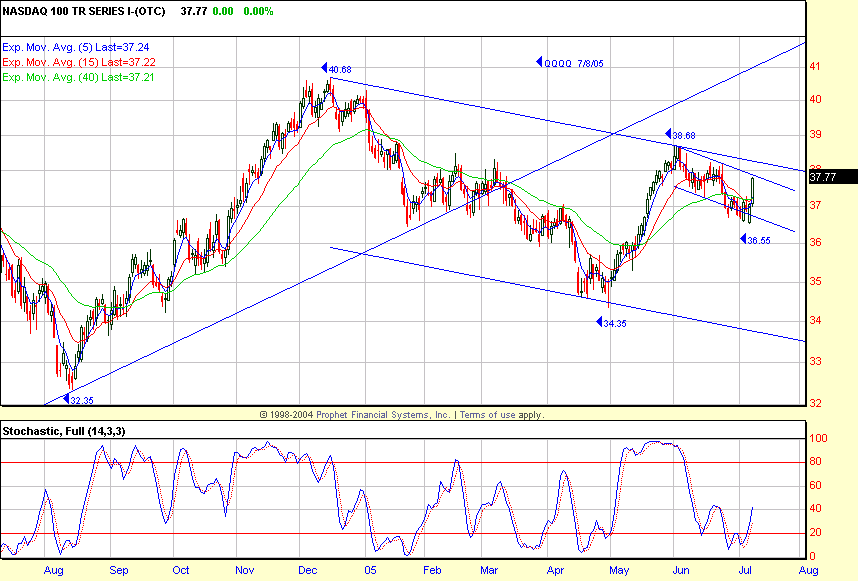
which had reversed its 12-month EMA after the 07/07/05 36.55 low, closed at
37.77, +1.9% and +2.7% for the week. The QQQQ is now pressing the upper channel
resistance lines (see chart). The Nasdaq
(
$COMPQ |
Quote |
Chart |
News |
PowerRating) was +1.8% to 2113 and
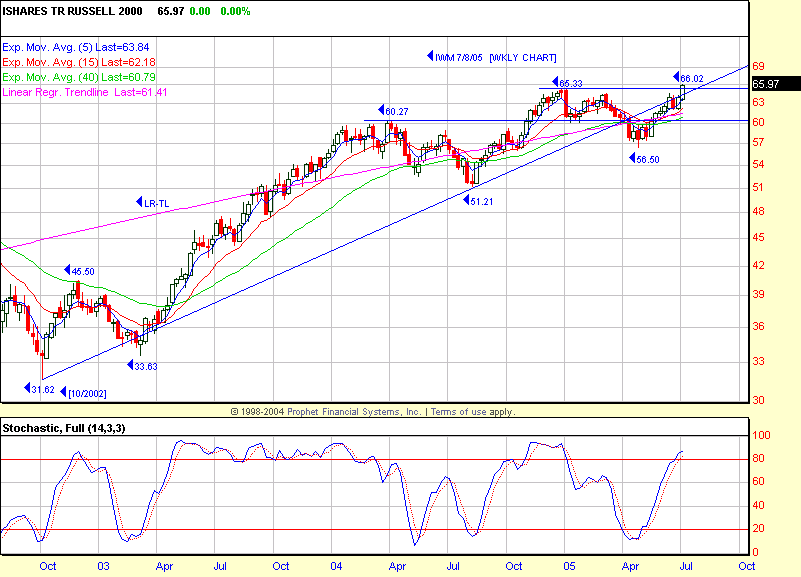
+2.6% on the week. The most significant index market action on Friday was the
(
IWM |
Quote |
Chart |
News |
PowerRating)
— the Russell 2000 — breaking to a new bull cycle high at 65.97 and above the
12/27/04 high of 65.33. The IWM is now above all of its rising 5-, 15- and
40-week EMAs, including its linear regression trendlines (see chart). The new
high now puts the IWM into a 1,2,3 HT (Higher Top) situation, so 65.33 is in
play near-term.
NYSE volume was a bit less than Thursday at 1.46
billion shares, with the volume ratio 80 and breadth +1675, so that means the
initial PPT action on Thursday picked up some company. The leading sectors were
the basic economic ones with the XLB (basic materials SPDR) +2.0%, $TRAN +2.0%
and XLI +1.7%. The
(
SMH |
Quote |
Chart |
News |
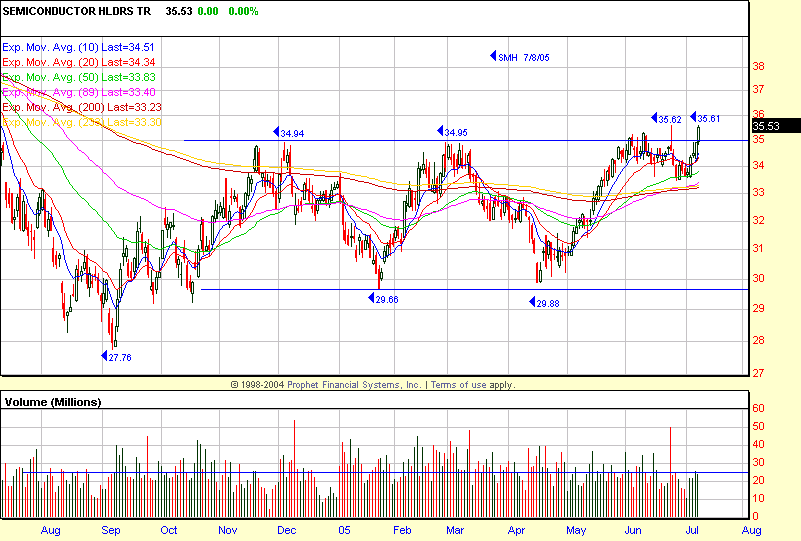
PowerRating) was +1.7% and +5.1% for the week, breaking out of
the range again which is price positive, but as you can see on the chart, not on
big volume yet. That makes the 34.95 – 35 zone the initial support level for
daytraders this week.
I put very little faith in government statistics,
and most of all the employment numbers as the Labor Bureau has so much leeway to
apply subjective opinion on the number of jobs, etc. I prefer to keep an eye on
the Economic Cycle Research Institute’s Weekly Leading Index (WLI) which showed an
annualized growth rate of +12.2% in November 2003 and +12.1% on 01/30/04. It
then declined to negative territory from 07/30/04 to 11/19/04 before it went
positive again. It only reached +4.0% by 03/18/05, but dropped to -0.3% by
06/03/05. For the last four weeks, it has gone from -0.3% to 0.0%, +0.2%, +0.9%,
and +1.4% last week, so it is in a positive trend now for those that follow the
economic numbers.
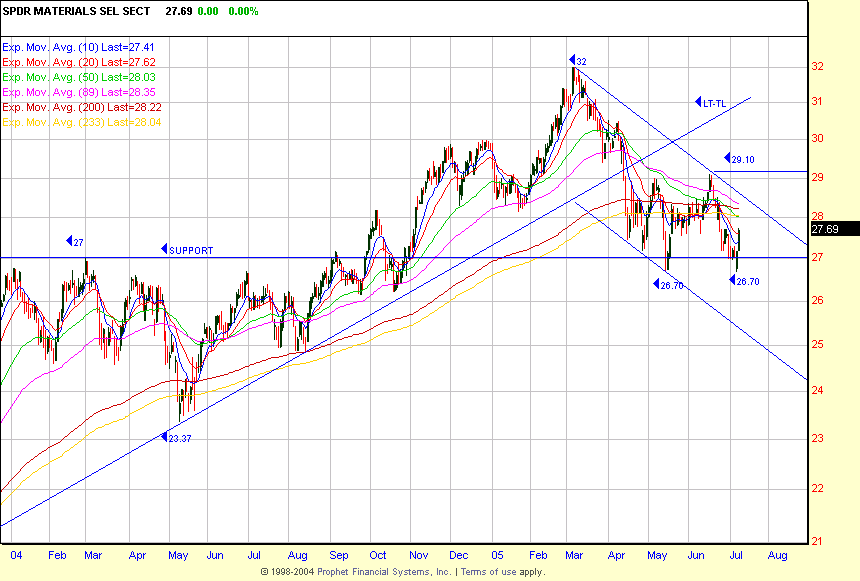
The XLB had initially declined -17% from the 03/04/05 32 high
to a 26.70 05/13 low. That’s in line with the WLI decline. The XLB then rallied
to 29.10 (.50 retracement 29.35) after reversing the 27 support level. It
declined again to 26.70 and then reversed 27 again, closing at 27.69 on Friday.
The 233- and 200-day EMAs are 28.02 and 28.22 with the downward channel line
about 28.50. It remains in a “Below the Line” status, so the daytrading bias is
to the short side on any continuation move up to the levels. You would also
check daily charts for the same levels of individual basic materials stocks. At
the same time, the semiconductors are a primary focus as long as the SMH can
hold the range breakout above 34.95. The
(
DIA |
Quote |
Chart |
News |
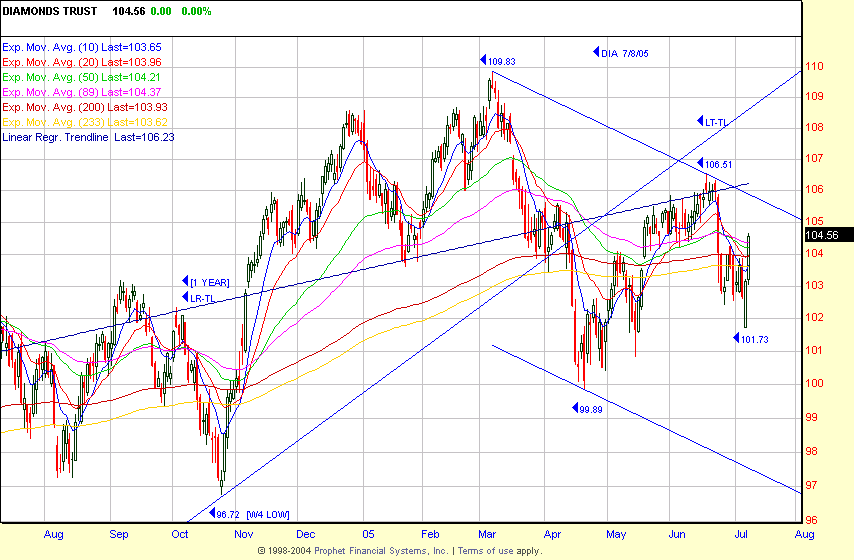
PowerRating) closed at 104.56, above the
longer-term EMA 104 – 103.60 zone. As you can see on the chart, the immediate
overhead resistance is 105.50 – 106. The 99.89 low wasn’t taken out, so there
has been no
1,2,3 LT (Lower Top) trend entry yet, but nothing changes until
106.51 is taken out after the -4.5% decline from 106.51 to 101.73.
The
(
SPY |
Quote |
Chart |
News |
PowerRating) is +2.6% from Thursday’s 118.27
intraday low,
and the DIA +2.8% from its 101.74 low, so there is no long intraday interest
unless there is retracement early this week. Initial SPY resistance is 121.75 –
121.95. The next daily chart RST is above 123.25, which is the 03/07/05 high and
a key price and time date which declined -7.9% high-to-low. FYI:Â It was also an RST entry which sequence and
Inner Circle traders were aware of well in advance
of the reversal. If you haven’t learned about RSTs, then I suggest you get to it
in a hurry.
This is being recorded Sunday for Monday.
Have a good trading day,
Kevin Haggerty
P.S. I will be
referring to some charts here:
www.thechartstore.com in the future.
