Current Market Trend Perspective
The SPX
(
$SPX.X |
Quote |
Chart |
News |
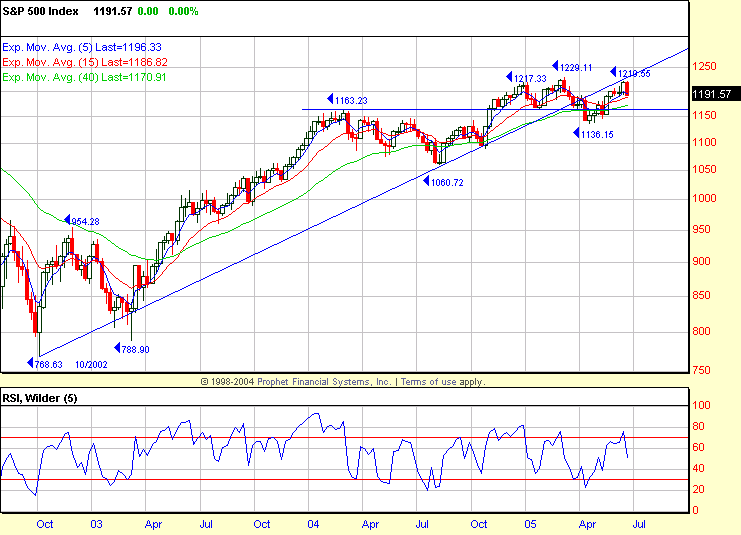
PowerRating) finished the week at
1191.54, -2.0% and -0.8% on Friday. The major indices all took a quick dive in
the last 20 minutes of trading Friday with the rebalancing program market
action. The Dow
(
$INDU |
Quote |
Chart |
News |
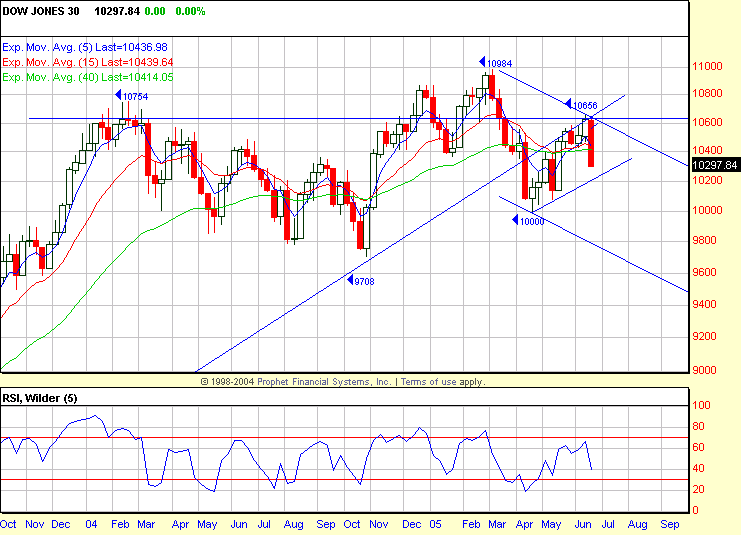
PowerRating) closed the week at 10,298, -1.2% on Friday and
-3.0% for the week due to the hard selloff on Thursday and Friday in the basic
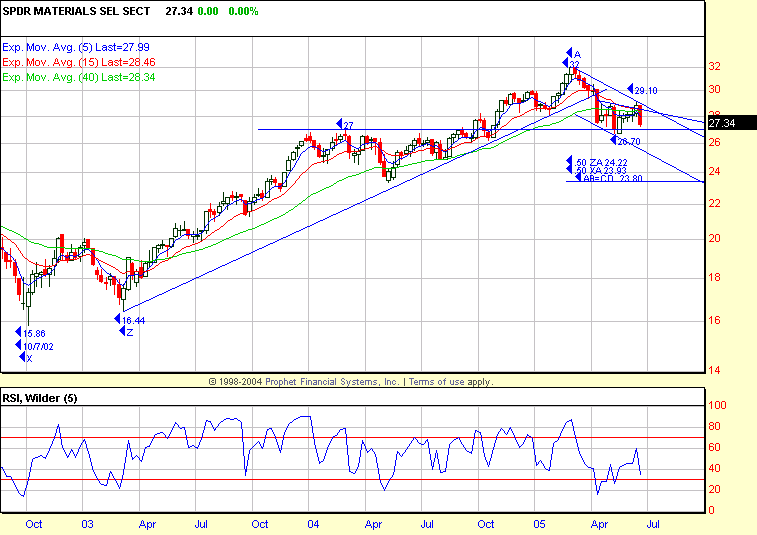
materials and industrial stocks. The XLB (basic materials SPDR) was -5.1% on the
week close-to-close and -5.9% high-to-close. At the same time, bonds moved
higher with the
(
TLT |
Quote |
Chart |
News |
PowerRating) +2.1%. The XLB is trading below its flattened out
40-week EMA of 28.34 with the five-week EMA below at 27.99, which is bear market
action unless the 40-week EMA and 29.10 mid-June intraday high is taken out (see
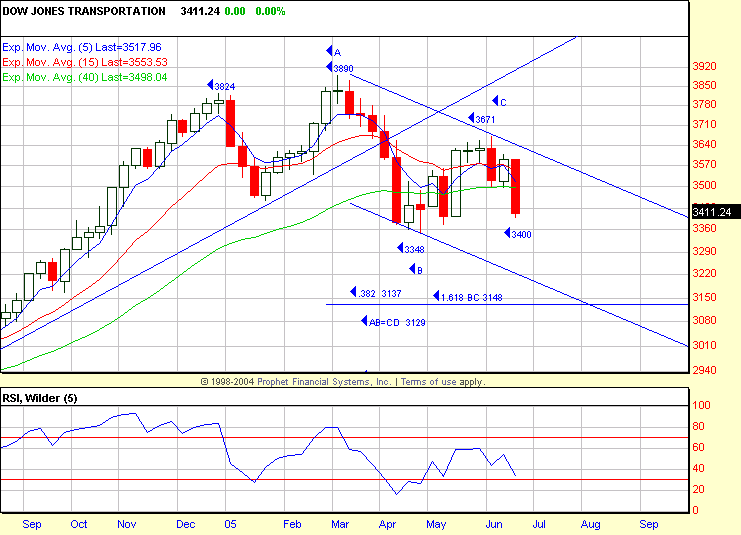
chart). The Transportation index ($TRAN) was also -5.0% on the week, closing
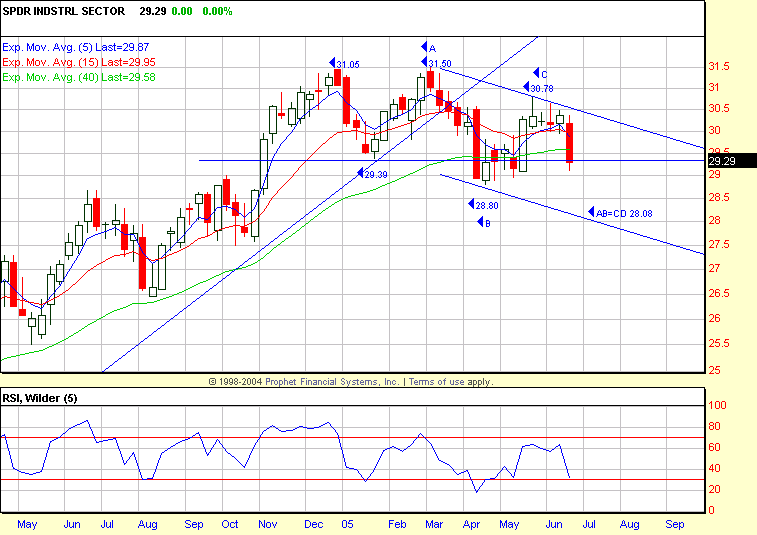
well below its 40-week EMA (3498) at 3411. The Industrials (XLI) were -3.5% on
the week and closed at 29.29 with the 40-week EMA at 29.58. As you might expect,
the Dow also re-crossed and closed below its 40-week EMA of 10,414. So, that
completes the most negative aspects of the current market picture. It doesn’t
matter the reasons attributed to last week’s market action, it is the price
levels that must be re-crossed on the upside to even turn it positive again. In
the meantime, retracements to the 40-week EMAs are possible short zones for many
of the related stocks to the mentioned sectors.
The SPX still remains in positive position,
despite the -1.9% move on Thursday and Friday, closing at 1191.54 with the
15-week EMA at 1186.62 and 40-week EMA down at 1170.91. The
(
QQQQ |
Quote |
Chart |
News |
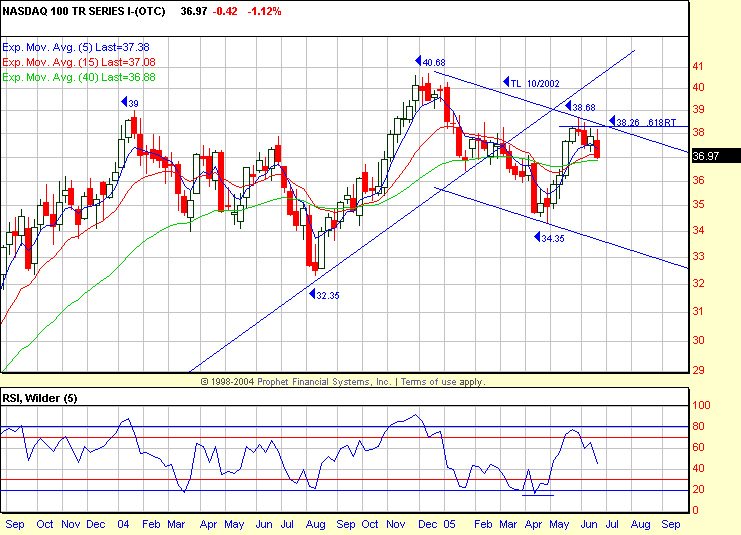
PowerRating) has now
retraced for three weeks from 38.68 intraday high to its 40-week EMA of 36.88,
closing Friday at 36.97. Daytraders should be ready for any upside reflex this
week from this zone. You would, of course, check the NDX 100 daily charts if you
trade individual stocks and see which ones are in the same position as the QQQQ
and keep them on your ready list this week. You should also have identified
those stocks which have much better relative performance than the QQQQ during
the past three weeks because they could catch an upside move into month-end. The
same would, of course, be true for S&P 500 stocks.
I have updated the key weekly charts, and they
give you a better picture of where we are now than I can put in words.
Have a good trading day,
Kevin Haggerty
P.S. I will be
referring to some charts here:
www.thechartstore.com in the future.
