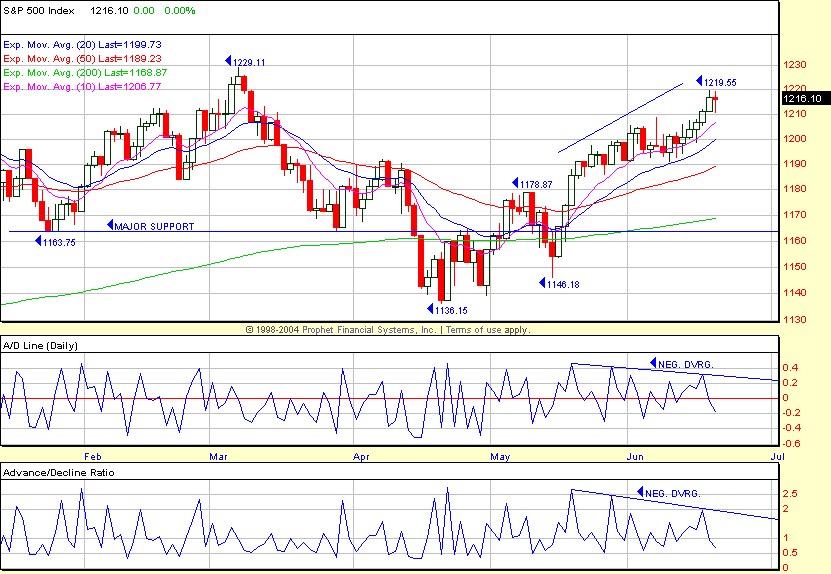
Price Advance Narrows Into Month-End With Negative Divergences
The SPX
(
$SPX.X |
Quote |
Chart |
News |
PowerRating) finished almost flat at
1216.10, -.86 (-0.07%) and the
(
SPY |
Quote |
Chart |
News |
PowerRating) +0.03% to 121.40. The initial
post-expiration move was down about 5 points to the intraday low of 1210.65 on
the 10:20 a.m. ET bar, and then it rallied to the 1219.10 intraday high by the
3:15 p.m. bar, closing at 1216.10. Suffice to say when the SPX traded down
early, the media (including TradingMarkets) said it was due to the spike in oil,
so if one believes that, then I guess the five straight up days last week for
the SPX were also due to a sharp increase in crude oil, which has been, in fact,
advancing for 19 days from the 48 level along with the advance in the SPX. The
Dow
(
$INDU |
Quote |
Chart |
News |
PowerRating) was -0.01% to 10,609, the
(
QQQQ |
Quote |
Chart |
News |
PowerRating) flat at 37.87 and the
Nasdaq -2 points to 2088. NYSE volume dropped to 1.27 billion shares, with the
volume ratio neutral at 46 and breadth -642. Net net, the market action was less
than informative to say the least. The XAU, -1.6%, XLB, -1.0%, and XBD, -1.0%,
led the red sectors, as nothing finished green.
There were two
RST trading entries yesterday with
the initial SPY RST buy above 121.02, which ran to 121.84, setting up an RST
sell entry below 121.71, which traded down to the 121.40 close. These two trades
were a positive note on a post-expiration Monday. It certainly beats Friday’s
early up and sideways for the rest of the session.
The bias is to the long side on any weakness into
month-end as the Generals will mark-up prices if they can and some hedge funds
will front-run that process. The current SPX move has narrowed from about 1190
to Friday’s 1219.55 intraday high as the Generals focus on their major holdings
mark-up. Overall breadth has shown a negative divergence as the SPX has
advanced, which is not a positive right now. The S&P 500 concentration is
evident also by the Bullish Percent index ($BPSPX, stockcharts.com) which is 66,
while the Nasdaq ($BPCOMPQ) is just 45%. It’s the Generals right now, folks, not
the public. The tech rally has also been narrow with the NDX 100 ($BPNDX) only
55% as fewer stocks carry this index. At the end of 2004, it was just over 80%,
while the SPX was about 78%. Always look for divergences as price approaches a
new RST level in either direction.
Have a good trading day,
Kevin Haggerty
P.S. I will be
referring to some charts here:
www.thechartstore.com in the future.

