Market Loses, Traders Win
What Tuesday’s Action Tells You
The market was minus yesterday, but traders were
a significant plus and from the long side, no less. “Have a good day.” The major
indices declined into quarter’s end on more than noise, as the SPX
(
$SPX.X |
Quote |
Chart |
News |
PowerRating) 995.94 and the Dow
(
$INDU |
Quote |
Chart |
News |
PowerRating) 9275 were both -1.1%. The
Nasdaq
(
$COMPQ |
Quote |
Chart |
News |
PowerRating) at 1787, was -2.1%, the
(
QQQ |
Quote |
Chart |
News |
PowerRating)s 32.40, -2.2%, and the
(
SMH |
Quote |
Chart |
News |
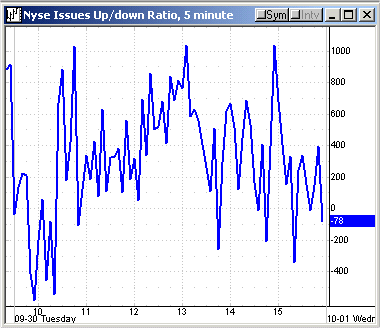
PowerRating) 34.37, -2.9%. NYSE volume expanded to 1.5 billion, volume ratio 32,
while breadth was only -128, which tells me the volume was concentrated in the
top index-weighted stocks. The worst performers were primarily technology stocks
like
(
AMAT |
Quote |
Chart |
News |
PowerRating),
(
NVLS |
Quote |
Chart |
News |
PowerRating),
(
QCOM |
Quote |
Chart |
News |
PowerRating),
(
ORCL |
Quote |
Chart |
News |
PowerRating),
(
MSFT |
Quote |
Chart |
News |
PowerRating),
(
INTC |
Quote |
Chart |
News |
PowerRating),
(
CSCO |
Quote |
Chart |
News |
PowerRating) and
(
KLAC |
Quote |
Chart |
News |
PowerRating). The percentage decline ranged from
-4.1% for AMAT to -2.8% for KLAC.
(
EBAY |
Quote |
Chart |
News |
PowerRating), at -4.2%, and
(
AA |
Quote |
Chart |
News |
PowerRating), at -4.4%,
were at the bottom of the top-weighted stocks.
In the major sectors, the BKX, CYC and RTH all
declined about the same percentage as the SPX, while the XBD was the downside
leader at -1.6%. Only the OIH closed small green.
The most ridiculous media line yesterday was
about the market being down because of
(
SUNW |
Quote |
Chart |
News |
PowerRating)‘s outlook. Sun was -.55, or
-14.2%, from 3.86 to 3.31. They fill their empty suits well.
For Active Traders
The trade setups were excellent after the
overreaction into the 10:30 a.m. time period. The media’s reasons, like Consumer
Confidence, Justice Department inquiry, or some individual company’s forecast
are prime allies of the smart trader, but we do get a big assist from the
futures gang trying to accelerate prices after mostly inane news events that are
long forgotten the next day, or mostly the next 30 minutes.
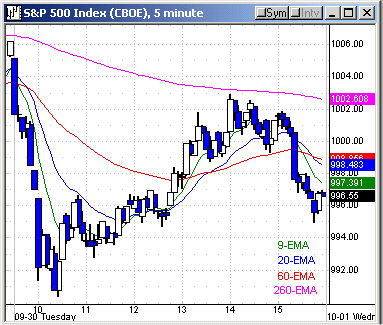
I have included the SPY chart today, which was a
no-brainer if you understand my strategies and the tools used to confirm a trade
as a high-probability setup with a positive mathematical expectation, which is
the core of my trading philosophy. The SPY traded down to a signal bar low of
99.25, which had an increase in volume (1) and a close in the top of the range.
99.53 was the .618 retracement to the August 96.34 low from 104.70. 99.20 is the
89-day EMA and was also just beyond the 20-day 30-minute 2.0 standard deviation
band, which means extended. The SPX low was 990.36 vs. its .618 retracement of
991.14. Yesterday’s 1.5 volatility band was 991.75, so the confluence in this
zone was excellent. Entry was above the signal bar high of 99.57, which also
re-crossed the 99.53 .618 retracement. The entry was on a significant increase
in volume (2). It was a Trap Door pattern, but it was also a large RST with good
symmetry which set up after breaking Monday’s 99.80 low. This trade carried up
to a 100.59 intraday high at the 240 EMA, then faded to close at 99.88.
If for some reason you didn’t take the trade,
those of you who have my strategies see that you got a second chance on a 1,2,3
higher bottom setup with entry above 99.68 on the initial pullback after the
first entry. I didn’t label the swing points in order to allow you to see the
first entry clearly.
It didn’t matter whether you played the SPY or
futures. The same Trap Door pattern and RST setups were also available in the
(
DIA |
Quote |
Chart |
News |
PowerRating), QQQ and SMH, not to mention many of the correlated big cap stocks.
The QQQs traded down to a 32.36 intraday low vs.
its .50 retracement to the August low of 32.40, then set up, while the SMH came
right back to the confluence with a 34.35 vs. the 34.52 .50 retracement to the
August low, in addition to several other numbers in that zone. That was the
third excellent reversal trade from this zone in the SMHs. I would say this zone
is now in a fill-or-kill situation. Both the QQQs and SMHs went out on the lows
at 32.40 and 34.77 on the SMHs, which isn’t very positive, as it is new closing
lows for both in this downtrend and the second closing day below the 50-day EMA.
The SPY made a new declining low at 99.20, which
is also the 89-day EMA, and 99.88 is the new low close in this current eight-day
retracement. The volume on the SMH was average, but significant in the QQQs at
119 million vs. its 62 million average and 72 million in the SPY, double its 35
million average. I must point out that there is an ever increasing amount of
hedging stock portfolios with QQQs and SPYs, plus it is the quarter’s end, so
there is no absolute read on the last day of the quarter because that increase
in volume is the norm, not the exception.
Today’s Action
We start today with the SPX having retraced -4.8%
from the 1040 high, and of course, there were two previous retracements of -5.2%
and -5.3% in that 1015 – 960 trading range, with the last one trading down to
96.34 on the SPY vs. its 50-day EMA of 98 at the time. The 50-day EMA is now
100.81 and the 200-day EMA is below at 96.62. Last week’s action reversed the
previous three weeks’ lows, with last week’s low being 101.05. It also reversed
a seven-week sharp rally off the August lows which began with this retracement.
From a position standpoint (not just a two- to
five-day trade), an ideal position setup would come from a retracement to the
12-month EMA and/or the Generals’ Pullback pattern (explained in the 553-page
manual). On a short-term basis, there were some good 50-day EMA setups for the
major indices after Monday’s trading, but that was negated with yesterday’s
lower high and low, which meant no trade-through entry above Monday’s highs. Any
short-term trade setup should have a close above the high of the low day and
early intraday entry can be taken prior to that and only held in position if it
did close above that high. You have to define the reversal pattern which
dictates any entry. You’re not guessing at a number.
Some new money being put to work these first few
days of the first quarter from a short-term oversold condition with the previous
seven to eight days down will benefit daytraders. Any further decline toward the
12-month EMA level will be bought by the Generals as the month-end in October is
key for many of the largest mutual funds, and they will push it in their favor
as much as possible.
Have a good trading day,
Kevin Haggerty


