A Line Has Been Drawn
Yesterday’s action saw both the bulls and the bears
walk away with something to show for their efforts. Ample shorting
opportunities in the morning and a few longs in the afternoon made for a decent
trading day overall. 920 and 923 were the levels that some good trades were
keyed off, and this should continue going forward. 927 will need to be taken out
on the upside for any meaningful rally to get underway.
I was pleased to see the 920 level give way at the close. This should be
significant (refer to yesterday’s column), but we will need to see some
follow-through to the downside.
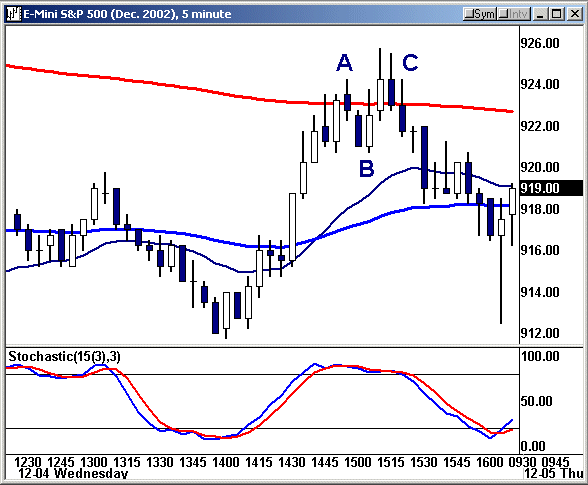
The best trades of the day yesterday were the “fades” of the quick pop up to
the 923 level in the afternoon. It also coincided with the 20-period moving
average on the 60-minute chart. If you missed this trade, look at the chart
below. It should offer you some good insight as to why these were relatively
high-percentage trades. Trading any of the semiconductor stocks off this pattern
played out real well.

The RED line is the hourly moving average
plotted on the 5-minute chart
The BLUE line is the 15-minute moving
average plotted on the 5-minute chart
Notice how at Point A the price action fails to close above key resistance
(hourly MA and the 923 level) after a decisive move to the upside. Naturally,
you are bucking the trend at that point in time, so you do not want to fall in
love with the trade. When there was no additional follow-through (Point B), you
needed to cover. Nonetheless, many of the semis came in enough to make this a
worthwhile trade.
Point C is actually what I had been hoping for the first time around. In this
instance, we have the same scenario — significant support giving way, but this
time we get nice follow through all the way to 919. I was in this short for 20
minutes or so, but when the S&Ps could not break below the 15-minute MA, it was
time to take the money off the table.
The gold stocks did not offer all that much action today as might have been
expected. The one trade, which I did not take, would have been to short the
underlying stocks (GFI, HMY, NEM, etc.) into
the big thrust up to 923-25 in the S&Ps. Gold stocks are trading contra to the
market, so keep this relationship in mind for today. The
XAU did manage to close just a hair above 68.97, which was
mentioned yesterday. This fact indicates that there may be some pressure
building within the sector.
For today, the game plan remains the same:Â I am looking to be shorting into
rallies assuming that the market opens weak. The market is vulnerable in here,
and there should be some good intraday pops to the downside, especially if we
break below yesterday’s lows, 909. One thing to be aware of, however, is that
these scenarios never play out as smoothly on the trading desk as they do here
in the column. A move above 927 may feed on itself and then allow for the S&Ps
to go and close the gap left of the opening Tuesday morning, 932-34. This
scenario would put the bulls firmly back in charge.
Make sure you are nimble, changing gears at the drop of a hat is a
requirement in this market. Ironically enough, the SOX components would be the
best play on the way back up. This makes our jobs as traders so much
easier. Focusing on lots of stocks is the quickest way to be the least effective
in my experience. There are so many nuances that can be discovered by simply
observing price action intraday, conclusions that could never be drawn by simply
looking at the chart. To effectively digest that information, it is not possible
for most traders to monitor more than 3-4 stocks at a time.
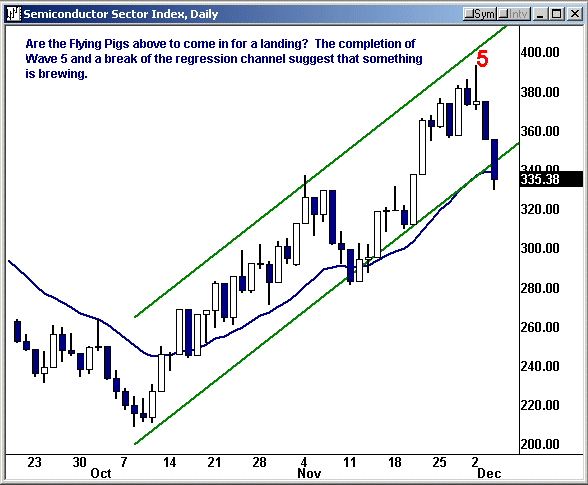
The SOX will continue to be my co-lead indicator next to the S&Ps. With
yesterday’s continued breakdown, it is safe to assume that 323 is the next
target to the downside. Naturally, the speculative money can come roaring back
in so be on the lookout for a move above 344 and 348.

Remember, the intraday volatility is still not present. All of my trades are
being gauged and identified on the 5- and 15-minute charts. This requires a bit
more patience, but the moves can be larger.
Key Technical
Numbers (futures):
S&Ps |
Nasdaq |
| 939 | 1091 |
| 929 | 1085.50 |
| 928 | 1081.75 |
| *921-23* | *1078.50* |
| 914 | 1073 |
| 910 | 1062.25 |
| 903 | 1052-54 |
| Â | 1045.25 |
* indicates a level that is more significant
As always, feel free to send me your comments and
questions. See you in TradersWire.
