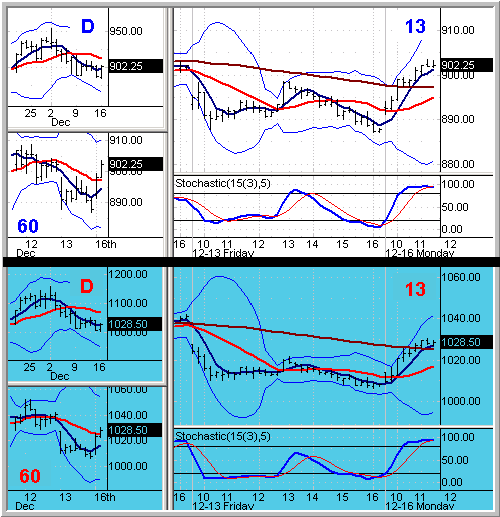
Here Are 6 Low-Risk, High-Probability Entry Options
The major indices are in the
green this morning, and are in clear 13-minute uptrends as we approach midday.Â
Both the Nasdaq and S&P markets are also
probing above critical hourly trend lines, albeit with the S&Ps showing a bit
better strength, and are thus setting up double 13/60 15MA supports in the 895
(ES) and 1025 (NQ) areas. With the hourly getting a bit extended heading into
the afternoon session, ES traders may want to consider any breaks on the three
for a retracement short and/or position for 13 & 60 min long pullbacks into
supports if we do get the retracement.
ES (S&P)Â Â Â Â Â
Monday December 16, 2002 11:30 A.M. ET       NQ
(Nasdaq)

Moving Avg Legend:
5MA
15MA 60-Min 15MA
See
School and
Video for Setups and Methodologies
Charts ©
2002 Quote LLC
The
Friday intraday index charts were, simply put, a beauty and once again
reinforced the methods we’ve discussed ad infinitum over the past few
years including the
E-Mini educational material. Looking back at Friday’s S&P chart, we had a
gap into a downtrend, deep pullback (1), further downtrend, shallow
pullback (2), shallow downtrend extension, cross to the north
(3), run to the 60, pullback (4), pop, cross down continuing
the hourly downtrend (5), and two pullbacks (6) before the
closing plunge.
If you’re keeping count, that’s
SIX
low risk high-probability entry options
using simply one timeframe — the
13-minute (with the hourly downtrend as a management backdrop) — over a one day
period. Look at one- or three-minute charts and that number grows. Yet I
continue to read much of the trading press babble something about this being
“one of the most difficult trading environments in years.” Hello?? Sorry folks,
but the only difficult trading environment I’m aware of is a market which is
flat-lined.
So if the market is providing opportunities such as Friday’s, why aren’t more
folks making money (that is, if you believe the press). First, you’ll likely
never hear from many of the successful traders as they purposely remain below
the radar screen. Second, it’s typically
trader mindsets that truly makes the market difficult, including past
psychological baggage, hesitancy, lack of faith in probability, and desire to
focus on fine-tuning methods so that folks become extraordinary engineers, yet
terrible traders.
Indeed, I continue to believe folks try to make this business more complex than
it is. As I’ve said before, the methods I practice involve just three boring and
simple indicators on two timeframes. That’s it.No Elliott Wave, no Fibonaccis,
no Put/Call, no TICK, no TRIN, and no use of the presidential election cycle
(I’ve always loved that one). All I want to know is trend, momentum, and range
on at least two timeframes. Is it THE best method?Â
Heck no, as no such panacea exists. Does that fact that the 3-minute 15MA is
close to the one-minute 50, and that the 13-minute 15MA is the same as
the one-minute 200Â — benchmarks that an abundance of traders follow —
help from a self-fulfilling prophecy perspective? You bet and I’ll leverage off
that advantage every day.Â
Do you use any of the other indicators mentioned above? Great … they can work
just as well IF you use them consistently. My point is to settle on
A method. For me, I prefer simplicity and use of
probability. Even in my former corporate executive career with all of the
degrees and background, I preferred graphs and pictures to illustrate key
business issues because, as a visual person, that’s simply how I’m wired.
Now of course, we won’t get days like Friday every day, but we neither need nor
should expect to. Perhaps you’ll look differently at Friday the 13th the next
time around.
Good Trading!
Â
