Chasing The Tiger Trade, Part 2: Choosing Your Time Frame
Welcome back. This week
we discuss time frame, with instructions on assembling the wheel.
For me, one of the most confusing and challenging
aspects of trading is knowing which time
frame to select. If you look at daily charts and then zoom in to a 60-minute
chart to fine-tune your entry, you are effectively changing time frames. But
what if you decide to zoom in more to a 5-minute chart, to get even more
precise? Do you calculate your stops on the 5-minute, 60-minute or a daily time
frame? What about profit targets? Which time frame do you use then? And what
does all this time frame change do to your expectancy?
I figured out that I like to daytrade so
I can either make regular amounts of money each day and if a trade goes better
than expected, hold on for a longer run. This is what I call
riding the trade,
catching the tiger. I like to look for the lowest-risk entries and then,
if the market allows me to do so, stay for the ride. I don’t always get it right
and sometimes the lure of profit has forced me to exit early. I usually trail
stops and often knocked out before I have had the chance to convert to higher
time frames. But I prefer this to giving back all the profits, losing the trail
of the tiger, so to speak. I have even let my profits turn into losses. There is
no excuse for doing that.
So, here is my approach:
(How I build the wheel!)
-
First of all, I constantly re-examine
my beliefs about the market and the amorphous crowd that really makes up the
market. I have a somewhat philosophical bent when it comes to the markets. I
know the market reflects the constant struggle between supply and demand. At
times, the demand for a stock or commodity increases and then, when that
demand exhausts itself, there usually follows a supply that is greater than
the demand. The pendulum is forever swinging. For some reason, whether due to
the fact that the crowd behaves as a “natural growth system†in the form of a
collective mind or whether these so-called natural levels given by Fibonacci
and co are self-fulfilling by the crowd, does not matter to me one iota. As
long as the levels are there and they have a harmonic feel about them, I
believe they are tradable. -
Secondly, I look to price extremes or
exaggerations of human emotion and if these coincide with one of the harmonic
levels, I watch the action at those levels for a price reversal. I do this
always on the daily charts but I take a peek at the weekly, and sometimes the
monthly, to get full perspective.If the weekly and the daily are synchronized, so much the better. If I like
the “zone†on the daily, I will then begin my analysis of the three spokes (entry,
risk and selection). My style of trading is to find potential “pressure
points†or zones on the daily charts where I think an increase in activity
will take place, maybe the 200-day moving average for example, but there are
many, many other points or zones. Double tops or bottoms, volatility bands,
Fibonacci levels, moving averages, etc.Once I am alerted to a “zone,†I then zoom into a 30-minute chart which is my
preferred trading analysis period. I won’t enter or exit using the 30 but I
will calculate my risk/reward on that time frame. To get a closer view I will
then watch the 3 and the 13 minute charts to “pull the trigger.†I am aware
always that the longer timeframe dominates the shorter so while the longer may
indicate a potential reversal, I watch the shorter for a break out in the
direction of the reversal. Sometimes I only take the second break out. I
believe that “the second mouse gets the cheese.â€This is my style and you will have to go through the motions to synchronize
your own style with your objectives, i.e., what you need to do to make a trade
that can and will achieve your goals, using your own strategy or strategies.
Each strategy will have its own risk-to-reward ratio and each one will have
its own unique expectancy.
Here is an example of finding a trade
using my style and the process I go through. I hope this helps you. It has
helped me.
First of all I create a trading universe.
This is the jungle where I go looking for tigers. Since I believe that the large
funds have the “big bucks†and the “big bucks†can push around the markets, I
will limit my universe to the S&P 500
stocks, the Nasdaq 100
stocks and the Dow 65,
(30 Industrials, 20 utilities and 15 transports). Because of some overlap, I
actually land up with 550 stocks altogether.
My style is to start with daytrading
strategies. Daytrading keeps me in the market, like a surfer, waiting for the
wave. One of the criticisms that the so-called “buy-and-hope” traders from the
last century had was that “if you tried to time the market,†you would miss all
the best days. Therefore, daytrading keeps me in the market. I then run a scan
on my “universe†each day to find all the stocks with large travel ranges. I am
looking for volatility or a large range that offers enough movement during the
day to achieve 3X or 4X my risk. What’s the use if a stock only moves 20c in a
day?
My scan is H-L > 2. This has been yielding about 65 stocks. I then flip through
these to see if any are approaching a “pressure point.†Note that a chart can be
ambiguous sometimes and then I ignore it. The mind can read patterns where none
exist, so unless I am totally convinced of a certain dynamic unfolding, I will
keep flipping the charts. When I think I spot something, I will draw my lines in
the sand according to my own belief system as to why there should be a line in
that location. Then I will check the risk-to-reward ratios and figure my
position size.
I am not going to try to tell you what or how to trade. Just go to the well at
TradingMarkets.com. You will have to trade your own beliefs. Trading is not
easy, so you have to keep it simple.
If you have figured that your “fit†is as
a daytrader, study Kevin Haggerty’s work and Larry Connors and David Floyd for
example. Look at Don Miller’s time frames. If you prefer Swing trading, check
out Dave Landry’s timeframe and Derrik Hobbs’ methods. By the way, have you
noticed that each of the above traders has his own methods, timeframes and
beliefs? There is no right or wrong, just many roads up to the top of the
mountain. Pick one and stay with it but pick the one that matches your
personality and your goals. Learn about the opportunities that your road will
offer. Get on your unicycle and start pedaling. At first, you will spin around
and around and fall off a lot. Then you will get it and you will begin to find
how to travel in a chosen direction. Then you can chase the tiger! But first,
lots of practice is needed.
The key to this discussion is that all
these components are inter-related. By that I mean stock selection will depend
on timeframe and timeframe will depend on risk-to-reward ratios and expectancy.
For example, say you have $100,000 in your equity account and you intend
daytrading to make a living. Now suppose your system triggers an alert for
(
GE |
Quote |
Chart |
News |
PowerRating)
which is trading say at $25.0 per share. Now if you are prepared to risk 1% of
your equity per trade then the maximum loss you can incur would be $1,000 for
that trade. If you intended to expose your margin account to a maximum of 25% of
your available “buying power†assuming you have no other positions open, then
you could buy or sell approximately 4,000 GE shares. (4000 X 25.00 =
+/-100,000).
Since you are only prepared to risk a $1,000 per trade of your original equity
capital, your stop must not be greater than $0.25 away from your entry. 4,000
shares X 0,25 = +/-$1000. If your stop is 0.35 away then you could buy or sell
only 2,800 shares. This is the subject of position sizing which we raise in the
next couple of weeks. Remember IF you are working
so tight, your time frame will have to drop to a 5-minute chart or you should
not buy 4,000 shares otherwise you violate your rules. If GE’s natural stop is
more than 0.25c away from your entry, its no use trading so tight or you will
just end up churning your account. Either you will have to widen your stop or
sell less shares or pass on that trade.
So we see that risk to reward is affected by size which is affected by
volatility which affects selection which also affects how you choose your
timeframe. They’re all related. Selecting the right time frame therefore means
that the timeframe chosen is appropriate for the total strategy which of course
must take into account your objectives. Hence your setup — stock selection,
risk control and opportunity — all depend on the timeframe selected. I hope
this will stimulate some of you to devise your strategies based on all these
inter-related components.
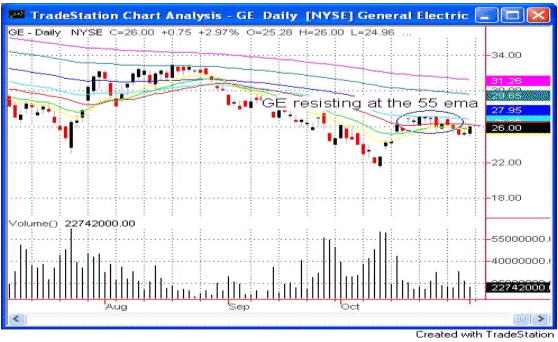
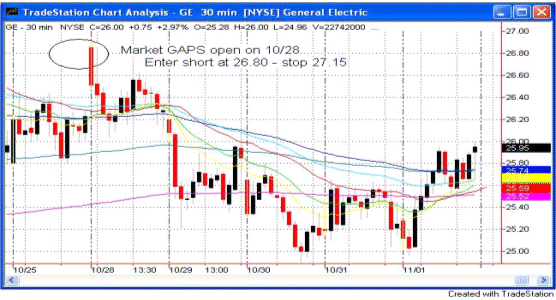
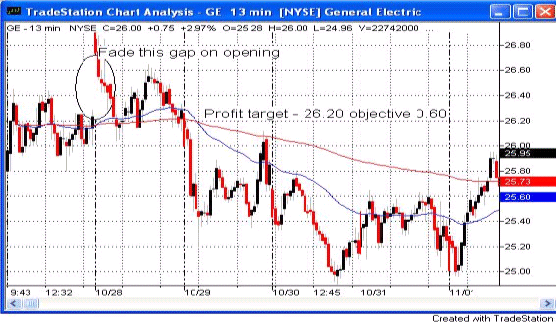
The following trade occurred on 10/28/2002:


In the above example, I was expecting
some resistance at the 55-EMA level. On 10/28 I saw the market gap up to the
resistance level and entered a short at $26.80. My stop was at 27.15 or .035
away. I sold 1,000 shares and covered at 26.20, a 60c objective or $600 profit.
I could have sold 2,800 and covered the next day at $25.25 for a theoretical
profit of $1.55 or $4,650. This is the subject of position sizing and is the
difference between a good trade and a mediocre trade, and when properly
understood and executed is the means to creating wealth from the markets.
Next Week: Why
timeframe controls the relationship between selection, method and risk control.
See you then and keep spotting those tigers!
Part
1 — Setting Objectives
(If I don’t know where I’m going, any road will take me there. — Apologies
to Alice in Wonderland.)
Part
2 – Choosing Your Time Frame
Part
3 – Why Time Frame Controls Everything.
Selwyn Gishen is a
private trader who has been a member of TradingMarkets since its inception. Before switching to equities in 1996, he traded foreign currencies and
South African bonds. He lives in Boca Raton, Fla.
