Here’s A Key Level On The SOX
Despite light volume and a very slow grind to the
upside, the market did manage to take out some key levels which
should set the stage for some higher prices for the next few days. Bonds
continued to drift off. I hope you were short the TLTs
and long the Countrywide Financial
(
CFC |
Quote |
Chart |
News |
PowerRating)
mentioned in
yesterday’s column. Gold continued to power higher. Naturally, all the
talking heads keep saying gold is a fluke, there is no real profit potential
there, etc., etc. Professionals know better, and their bottom line proves it. I
would venture to say that the next pullback in gold stocks, provided the metal
itself stays above 327, will offer a nice long entry for a long-term trade,
several days or weeks. In the meantime, they continue to trade well intraday
based on setups on the 5- and 15-minute charts.
The very fact that the S&Ps settled at exactly 909 yesterday is not only key
(it was big support last week), but also proves without a doubt that the markets
are not random. Nonetheless, without drawing a line in the sand, it is fair to
say that the “Santa Claus” rally that everyone and their brother have been
talking about may be upon us. As of 5:30 AM PST, the S&Ps are under a bit of
pressure, but nothing that you can draw any conclusions from.
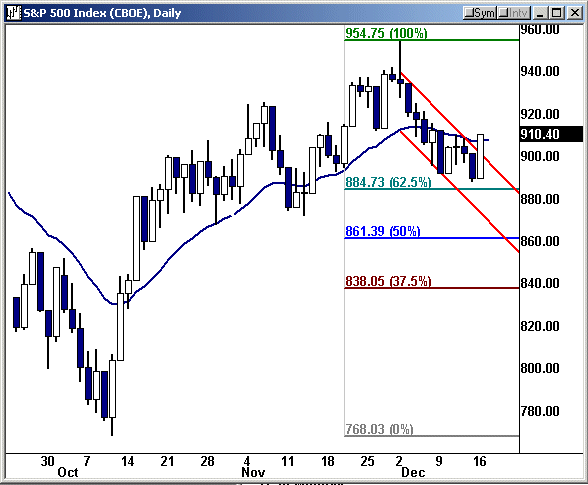
The chart below of the S&P cash index indicates that despite the recent
selloff, the pullback off the Dec. 2 highs did not even to manage to carve out
and test the 62.5 retracement (884) off the October lows. That combined with the
breakout of the downward regression channel leads me to believe that more buying
is in store. Of course, this is simply an observation. With
Best Buy
(
BBY |
Quote |
Chart |
News |
PowerRating) announcing weaker sales,
it may feed on itself. Nonetheless, seasonal tendencies and the OPM
(other people’s money) crowd seem hellbent on a move higher into the later part
of the month.

If in fact this does play out, it would be natural to go right back to
trading the most speculative sector, tech, and semiconductors in particular.
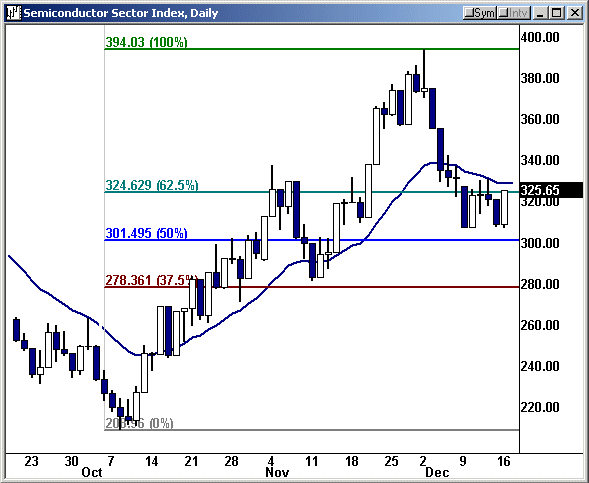
As can be seen on the chart below, the SOX has managed to retrace to the
62.5% – 50% retracement area of the December highs/October lows and appears to
be consolidating. This is encouraging, a decisive break above 324-26 should
invite more players into the underlying stocks.

Below, are some stocks I will be keeping an eye for
some intraday moves. Obviously, the entry points need to coincide with overall
intraday market direction. So, be sure to take a look at these issues on both
30- and 60-minute charts to gauge the best entry points. Look for pullbacks and
consolidation as a heads up for an entry point.
| Intraday Setups | |
| Â | |
Stock |
Action |
| COF | Short |
| FRX | Short |
ROOM |
Short |
DLTR |
Long |
XRAY |
Long |
Â
Key Technical
Numbers (futures):
S&Ps |
Nasdaq |
| 927 | 1062.50 |
| 923 | 1055 |
| *916* | 1051 |
| 909 | 1045.25 |
| *900-03* | *1041* |
| 896 | *1029* |
| *884* | 1021.50 |
| Â | 1013 |
* indicates a level that is more significant
As always, feel free to send me your comments and
questions.
