Longer-Term Symmetry May Mean Good Position Play
The
first day of the new year was a power day,
as the NYSE floor was inundated with buy
programs as the Generals put some money to work. Most of the
(
SPY |
Quote |
Chart |
News |
PowerRating) volume
was in the first 45 minutes. Volume was not indicative of price, however, as the
Generals were not aggressive on the sell side after they saw the rush to come
back in on the buy side after the gap pullback. NYSE volume was only 1.2
billion, less than average, but you see the buy program urgency with the volume
ratio at 94 and 1.1 billion on the upside. Breadth was the same kind of strength
at +1834. The SPX
(
$SPX.X |
Quote |
Chart |
News |
PowerRating) and Dow
(
$INDU |
Quote |
Chart |
News |
PowerRating) each gained 3.3%, while
the NDX
(
$NDX.X |
Quote |
Chart |
News |
PowerRating) was +4.4% and the Nasdaq
(
$COMPQ |
Quote |
Chart |
News |
PowerRating) +3.7%. Most all
of the major sectors were up about the same as the SPX and Dow, so it was across
the board.
The
(
SMH |
Quote |
Chart |
News |
PowerRating)s advanced
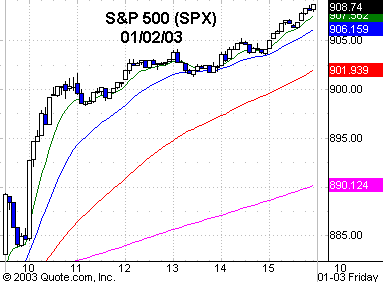
7.5% from the .618 zone. You had an excellent gap pullback trade from a dynamite
triangle with entry above 22.37 and all of its EMAs. The SPY gapped to 88.85 on
the open, traded up to 89.40 on the first five-minute bar, which was right at
the 1.618 Fib extension of 89.33. It was a four-bar pullback to 88.54 from
89.40, filling the gap and holding the closing range while remaining above the
previous day’s high. The fourth pullback bar gave you the setup as the signal
bar, with a close in the top 25% of its range and above the previous close, and
also above the 8, 20, 60 and 260 EMAs on your five-minute chart.
After that, traders got
lucky with the moonshot that was an up, sideways and up day, closing at 90.74.
Entry was above 88.80. Trading above the 88.85 open put the SPY into net plus
territory, which means above both the open and previous close. The gap pullback
and go trade is covered in my new
Opening Hour module and the dynamics that make it explosive.
It only took one day of
extended price to clear all of the daily EMAs and Fib extension levels that we
had in our trading plan, and now putting us into a potential 1,2,3 top zone. The
SPY had an intraday high of 91.30 vs. the 91.58 .50 retracement to 96.05, and
the Dow was similar. The
(
QQQ |
Quote |
Chart |
News |
PowerRating)s hit 25.55 vs. its .50 retracement at 26,
while the SMHs hit 23.82, but have plenty of room, as the .236 retracement is
just above at 24.12.
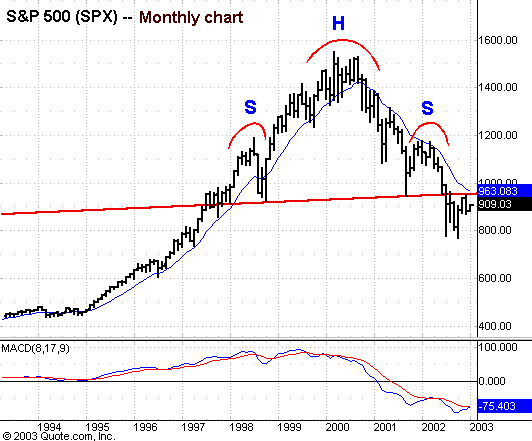
It gets interesting if
the SPX can move up into the 920 – 960 resistance. The key resistance is the big
head-and-shoulder neckline that you see on your monthly chart now at around 950
– 955 which has stopped both attempts so far. The first being the 965 Aug. 22
top and the recent Dec. 2 954 top. The 200-day EMA has also declined to around
952. The 12-month EMA is just above at 963, so we have lots of wood above us.
The Jan. 13 – 18 time
period has several Fib ratio dates, but more importantly, there is some
significant much longer-term symmetry that comes into play, so for me, that has
the potential for a good position play. Failure to get past the 920 – 960 level
into that period would mean a short side position strategy.
I have included a
longer-term monthly chart of the SPX highlighting the two failures at the
neckline, and it also points out how the 12-month EMA has contained price
throughout this bear market. On Monday I will highlight what to look for as
something approaches a potential reversal zone. You don’t trade the numbers, you
trade the pattern and the dynamics.
Have a good trading day,
and have a great weekend.

Â

Five-minute chart of
Thursday’s SPX with 8-, 20-,
60- and 260-period
EMAs

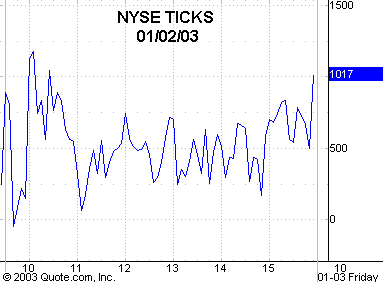
Five-minute chart of
Thursday’s NYSE TICKS
