How To Take Longer-Term Positions Using Intraday Entry
What Wednesday’s Action Tells
You
The major indices made it through the day is
about all you can say about yesterday’s market action. The SPX
(
$SPX.X |
Quote |
Chart |
News |
PowerRating)
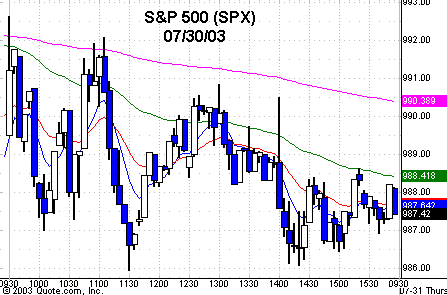
closed at 987.49 vs. 989.28 the previous day, the Dow
(
$INDU |
Quote |
Chart |
News |
PowerRating) closed at
9200, just 4 points below Tuesday’s close. The Nasdaq
(
$COMPQ |
Quote |
Chart |
News |
PowerRating) went out
at 1721, -0.6%, and the
(
QQQ |
Quote |
Chart |
News |
PowerRating)s 31.41, -0.8%. NYSE volume was 1.35 billion, a
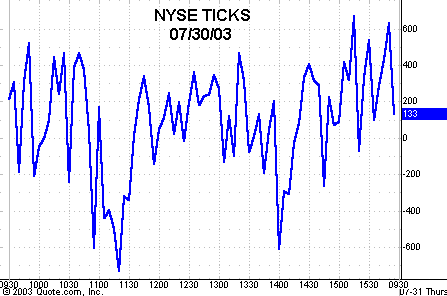
volume ratio of 40, and breadth -115. The travel range was choppy and the daily
range for the SPX was only 6.6 points, one of the lowest range days this year.
The
(
SPY |
Quote |
Chart |
News |
PowerRating) traded 32% less than its average volume, the
(
SMH |
Quote |
Chart |
News |
PowerRating) -47%, and
the QQQs -31%, so that tells you what kind of day it was.Â
In the sectors, the
(
PPH |
Quote |
Chart |
News |
PowerRating)s were +1.1% on less
than average volume, but worth keeping an eye on as they have retraced from an
86 rally high to a 77.18 close yesterday, just below its 200-day EMA of 77.63.
You should also look at stocks with similar setups, like
(
PFE |
Quote |
Chart |
News |
PowerRating), which was
+2.5% yesterday and now moves to the daily focus list. The Generals love to buy
these kinds of retracements to rising 200-day moving averages.Â
For Active Traders
Traders had a couple of opportunities trading the
E-minis and/or SPYs yesterday, in spite of the SPX’ narrow range. The first was
a Trap Door on the SPY above 99.25, the high of the 10:05 a.m. ET bar, but it
only ran to 99.64, right at the 240 EMA on the five-minute chart, then reversed
to the intraday low of 98.93 by the 11:30 a.m. bar. This was also an RST long
setup, with entry above 99.10. This trade ran to 99.52 and then back to the 240
EMA again where it failed, trading down to 98.96 and closing at 99.11. They are
two strategies that are explained in the seminar video, but you might also have
played the retracement shorts at the 240 EMA. Net net, the choppy travel range
did provide opportunity, but not moonshots that sometimes occur on trend days.
You take what the market gives you.
I have also included the daily and five-minute
charts today of
(
BSC |
Quote |
Chart |
News |
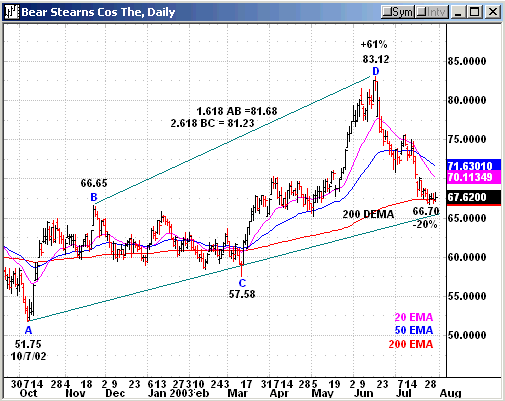
PowerRating), which demonstrates how you can take a longer-term
position using an intraday entry, or else just do the intraday trade. The best
daytrades will most often come from good daily chart setups. In this BSC
example, you see that the stock rallied 61% from its October 2002 low to an
83.12 high. FYI: I have pointed out the confluence zone of Fibonacci extension,
which is 81.68, the 1.618 extension of the AB leg, and 81.23, the 2.618
extension of the BC leg. You should always be aware of these zones, whether you
have a long-term position or just a daytrade. BSC has now retraced to the
200-day EMA, which is 67.45, as I pointed out on the five-minute chart. The
200-day EMA is also at the trendline from the October lows through the start of
the March rally.
The brokers have been one of the best-performing
major sectors since the October lows for the major indices. When you look for
trading ideas for position or daytrades, you are looking at your daily charts.
As you can see on the daily chart, BSC has an excellent setup, regardless of
what kind of trade you are looking for.
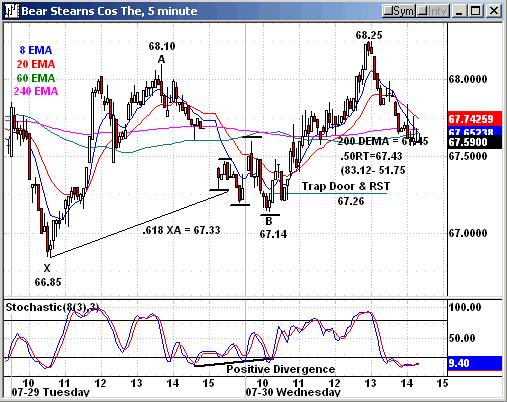
Having said that, now refer to the two-day
five-minute chart, which gives you the intraday setup yesterday in BSC. The
stock rallied from 66.85 to 68.10 and then retraced to the .618 zone of the XA
leg, which is 67.33. The actual intraday low yesterday was 67.14 on the 10:10
a.m. bar. This gave you a Trap Door entry above 67.26, which was also an RST
buy entry, and I have outlined the pattern with the little lines. That RST
pattern is discussed at length in the seminar material.
67.43 was the .50 retracement between 83.12 and
51.75 and along with the 200-day EMA of 67.45, there was a significant
confluence of tools which said take the trade. As you see on the chart, BSC ran
to 68.25 and if it had closed at or near that level, your decision might have
been to take it as a position trade. BSC will probably make some percentage
retracement to 83.12, if in fact the stock is finished, so you would have a
1,2,3 lower top, double top, or possibly a 1,2,3 higher top if the market takes
off again. The stock could very easily trade lower than the current 200-day EMA
zone before it makes a retracement to 83.12, but that’s a decision you make
every time you take a position trade. The point is it’s a very good probability
trade level that you can go either position or daytrade, and maybe both.
The five-minute chart doesn’t show the full
trading day, as the stock reversed at 68.25, trading down to 67.30, closing
at 67.28. If you just daytrade and are familiar with RSTs, you see that it was
an RST sell pattern entry below 68.16, which was the low of the 68.25 high bar.
So, regardless of the neutral major index action yesterday, there was
opportunity for the astute trader who knows what to look for, and there are many
who don’t know how to do that effectively, so make sure it’s not you.Â
Today’s Plan
With the major indices almost unchanged, the
20-day EMA pivots are all in play again today, and more importantly, you are
ready to play any overreaction move that is accelerated by the funny money
futures game during the day.
Have a good trading day,
Kevin Haggerty


