Monday’s Stock Watch
After Monday’s huge turn
around, the question now facing market speculators is whether or not
it marked a bottom of some sort. At this point we’d like to see a rally occur on
one of the major indexes with a gain of at least 2% on heavy volume. Follow
through of this sort will indicate that institutional players are willing to
step up and support this market. As always, it’s a wait and see game.
The Semiconductor Index’s
(
$SOX.X |
Quote |
Chart |
News |
PowerRating) massive
sell off Thursday was a red flag, as this sector very often provides leadership
for rallies. The index broke key support on its weekly chart that now gives it
new support around 200. As
Dave Landry asked in his Thursday column, “who’s next”. This market has a
lot to prove before intermediate-term traders think about buying.
For the past three weeks, the NYSE has made three
accumulation days and five distribution days, while the Nasdaq has scored three
accumulation days and three distribution days.
Mark Boucher‘s market breadth indicators showed a huge increase in lows,
with four day’s showing over 100. Any number above 20 is considered bearish.
Due to market conditions, this report no longer has
a single stock that qualifies for the report. Hopefully this will soon change as
we continue to search.
Market breadth was positive, with NYSE
advancing issues over declining issues by a ratio of 1.36, and up volume over
down volume by a 1.14 ratio. Nasdaq advancing issues over declining issues came
in at 1.23, and up volume beat down volume by a 1.44 ratio.
The Dow Jones Industrial Average
(
$INDU.X |
Quote |
Chart |
News |
PowerRating) closed up 0.95% at 8264.67. The S&P 500
(
$SPX.X |
Quote |
Chart |
News |
PowerRating)
closed up 1.68% at 852.82.
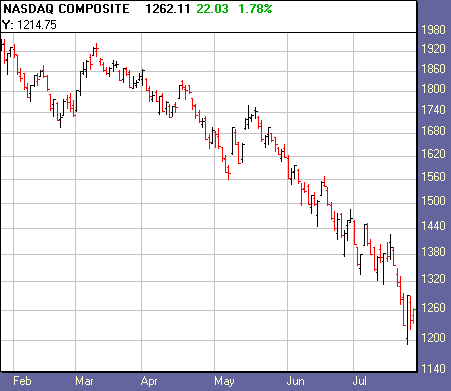
The Nasdaq
(
$COMPQ |
Quote |
Chart |
News |
PowerRating) closed up 1.77% at 1262.07.

Â
 1,821
 1,817
Declining Issues
 1,341
 1,483
 1,068,489,990
 839,398,959
 940,812,200
 582,576,593
Total
Volume
 2,021,155,980
 1,434,106,215
Highs
 22
 56
  201
 242
Top sectors:
S&P Insurance Index
(
$IUX.X |
Quote |
Chart |
News |
PowerRating), up 5.03% at 251.51, and the
GSTI Internet Index
(
$GIN.X |
Quote |
Chart |
News |
PowerRating), up 4.27% at 61.89.
Losing sectors:
Gold and Silver Index
(
$XAU.X |
Quote |
Chart |
News |
PowerRating), down
6.32% at 55.73.
North American Telecoms Index
(
$XTC.X |
Quote |
Chart |
News |
PowerRating),
down 4.72% at 316.34.
Sectors with Most New 52-Week Highs (10 or more):
None
Watch List Action:
None
Recent Breakouts
size=2>We monitor the action of Recent Breakouts as an indicator of
the market health for IT traders. When breakouts are acting well, this is a good
sign for the likelihood of further sustainable breakouts. When breakouts are
failing, IT traders should be even more cautious.
| color=#ffffff size=2>Company Name | color=#ffffff size=2>Symbol | color=#ffffff size=2>12 Month RS | color=#ffffff size=2>Price | color=#ffffff size=2>Price Change | color=#ffffff size=2>Average Volume | Pivot | 52-Week High |
None | Â | Â | Â | Â | Â | Â | Â |
Stocks Forming a Handle
| color=#ffffff size=2>Company Name | color=#ffffff size=2>Symbol | color=#ffffff size=2>12 Month RS | color=#ffffff size=2>Price | color=#ffffff size=2>Price Change | color=#ffffff size=2>Average Volume | Pivot |
None | Â | Â | Â | Â | Â | Â |
Stocks Building A Base
color=#ffffff size=2>Company Name | color=#ffffff size=2>Symbol | color=#ffffff size=2>12 Month RS | color=#ffffff size=2>Price | color=#ffffff size=2>Price Change | color=#ffffff size=2>Average Volume |
None | Â | Â | Â | Â | Â |
 |  |  |  |  |  |
href=”mailto:danielb@tradingmarkets.com”>danielb@tradingmarkets.com
If you are new to the “IT” strategy, be sure to
take a look at our
intermediate-term online trading course.
Intermediate-Term Traders
Report is posted on
Tuesdays and Fridays. For other intermediate-term commentary, be sure to read
Mark Boucher (Fridays),
Tim Truebenbach (Tuesdays and Thursdays), and
Gary Kaltbaum (Mondays and Thursdays).
