Friday’s Stock Watch
Bulls took control late
session today, pushing the indexes to close at the day’s highs,
with above average volume making for accumulation on the exchanges. Leading the
pack were semiconductors, networking, biotechnology, and Internet stocks, with
gold and silver, oil service, and airline stocks posting the biggest losses. The
number of new 52-week highs failed to make a strong presence, as the lows once
again ruled with drugs, electronics, software, and utilities making the highest
counts. Stocks on our watch list were mixed.
As mentioned several times in this report, and by IT
columnists on the site, this is a horrible market to go long in. Until we see
successful breakouts from stocks possessing the strongest of fundamental and
technical factors, the setups listed here are considered to be used as an
indication of overall market health.
Market breadth was mixed, with NYSE
declining issues over advancing issues by a ratio of 1.72, and up volume
over down volume by a 1.21 ratio. Nasdaq declining issues over advancing issues came in
at 1.43, and up volume beat down volume by a 3.90 ratio.
The Dow Jones Industrial Average
(
$INDU |
Quote |
Chart |
News |
PowerRating) closed down 0.13% at 8801.53. The S&P 500
(
$SPX |
Quote |
Chart |
News |
PowerRating)
closed up 0.74% at 927.33.
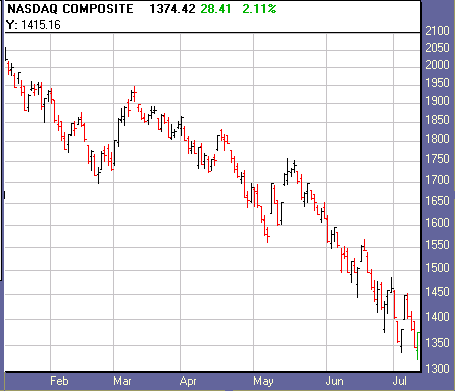
The Nasdaq
(
$COMPQ |
Quote |
Chart |
News |
PowerRating) closed up 2.11%
at 1374.46.

1,184
1,433
Declining Issues
1,972
1,959
1,318,826,530
1,542,870,300
1,106,490,490
396,594,000
Total
Volume
2,438,527,750
1,958,010,500
Highs
31
79
144
214
Top sectors:
Semiconductor Index
(
$SOX.X |
Quote |
Chart |
News |
PowerRating), up 6.84% at
372.42.
Multimedia Networking Index
(
$GIP.X |
Quote |
Chart |
News |
PowerRating), up
6.38% at 62.85.
Losing sectors:
Gold and Silver Index
(
$XAU.X |
Quote |
Chart |
News |
PowerRating), down 3.57% at
75.47.
Oil Service Sector Index
(
$OSX.X |
Quote |
Chart |
News |
PowerRating), down
2.90% at
84.80.
Sectors with Most New 52-Week Highs (10 or more):
None
Watch List Action:
Apollo Group
(
APOL |
Quote |
Chart |
News |
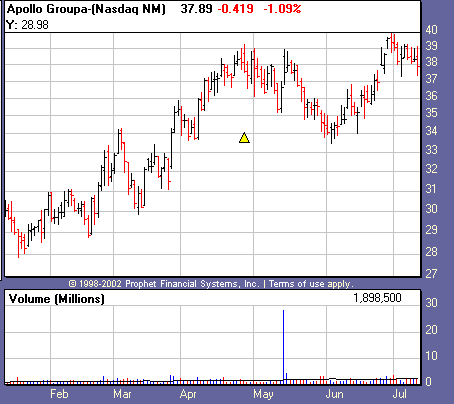
PowerRating) fell 1.09% on above average volume for a
distribution day. Distribution in the handle is an ugly sign, though the stock
is in a handle which is still a bullish sign.

Winnebago Industries
(
WGO |
Quote |
Chart |
News |
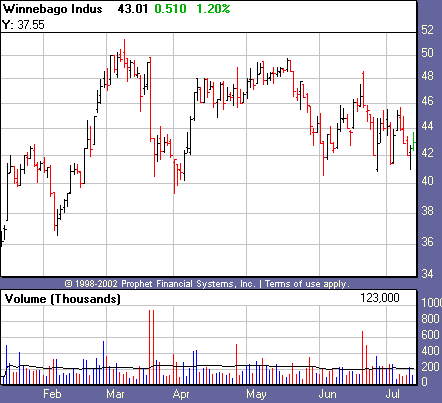
PowerRating) was our biggest gainer of the day as it rose
1.16% on slightly above average volume for an accumulation day. The stock is
trading below its 50-day moving average, though may be able to form the right
side of a base in here.

Recent Breakouts
size=2>We monitor the action of Recent Breakouts as an indicator of
the market health for IT traders. When breakouts are acting well, this is a good
sign for the likelihood of further sustainable breakouts. When breakouts are
failing, IT traders should be even more cautious.
Christopher & Banks
(
CHBS |
Quote |
Chart |
News |
PowerRating), down 4.14% on
above average volume for its second distribution day in a row.
| color=#ffffff size=2>Company Name | color=#ffffff size=2>Symbol | color=#ffffff size=2>12 Month RS | color=#ffffff size=2>Price | color=#ffffff size=2>Price Change | color=#ffffff size=2>Average Volume | Pivot | 52-Week High |
Christopher & Banks | ( CHBS | Quote | Chart | News | PowerRating) | 94 | 40.71 | – 1.76 | 358,000 | 33.60 | 42.45 |
Stocks Forming a Handle
Apollo Group Inc.
(
APOL |
Quote |
Chart |
News |
PowerRating), down 1.12% size=2>
on above
average volume for a distribution day.
| color=#ffffff size=2>Company Name | color=#ffffff size=2>Symbol | color=#ffffff size=2>12 Month RS | color=#ffffff size=2>Price | color=#ffffff size=2>Price Change | color=#ffffff size=2>Average Volume | Pivot |
Apollo Group Inc. | ( APOL | Quote | Chart | News | PowerRating) | 83 | 37.88 | – 0.43 | 2,314,200 | 40.08 |
Stocks Building A Base
Coach Inc.
(
COH |
Quote |
Chart |
News |
PowerRating), up 0.04% size=2>
on above-average
volume.
DR Horton Inc.
(
DHI |
Quote |
Chart |
News |
PowerRating), down 3.84% size=2>
on above-average
volume for a distribution day.
Penn National Gaming
(
PENN |
Quote |
Chart |
News |
PowerRating), up 0.73% size=2>
on below-average
volume.
Winnebago Industries
(
WGO |
Quote |
Chart |
News |
PowerRating), up 1.16% size=2>
on above-average
volume for an accumulation day.
color=#ffffff size=2>Company Name | color=#ffffff size=2>Symbol | color=#ffffff size=2>12 Month RS | color=#ffffff size=2>Price | color=#ffffff size=2>Price Change | color=#ffffff size=2>Average Volume |
Coach Inc. | ( COH | Quote | Chart | News | PowerRating) | 91 | 23.21 | + 0.01 | 1,214,600 |
DR Horton Inc. | ( DHI | Quote | Chart | News | PowerRating) | 88 | 23.75 | – 0.95 | 1,392,200 |
Penn National Gaming | ( PENN | Quote | Chart | News | PowerRating) | 88 | 16.37 | + 0.12 | 606,300 |
Winnebago Industries | ( WGO | Quote | Chart | News | PowerRating) | 89 | 42.50 | + 0.49 | 217,600 |
href=”mailto:danielb@tradingmarkets.com”>danielb@tradingmarkets.com
If you are new to the “IT” strategy, be sure to
take a look at our
intermediate-term online trading course.
