Energy Stock Retracement Set Up Trap Door Windfall Yesterday
The
SPX was soft following expiration, closing at 1221.13, -0.6%, on a
relatively narrow range day of 6.8 points. Prior to yesterday, the SPX was up
nine of the previous ten sessions and went plus for the last seven in
succession, so any kind of retracement would not be a surprise. NYSE volume was
light at 1.23 billion shares, with the volume ratio 32 and breadth -747, which
makes it four negative breadth days in succession. The Dow, 10,575, and Nasdaq,
2001.45, were each -0.6%, with the QQQQ, -0.4% to 38.73. The first two hours of
trading yesterday had the XLB, IWM and SMH leading the downside, with only the
XAU on the green side, which later reversed down, closing -0.3%. I don’t like
the combination of the XLB and semiconductors both on the downside–it very
rarely leads to a big day. The BKX led the downside sectors at -1.1%, led by
Citicorp, -3.1%. (Yes, it’s earnings season again).
Â
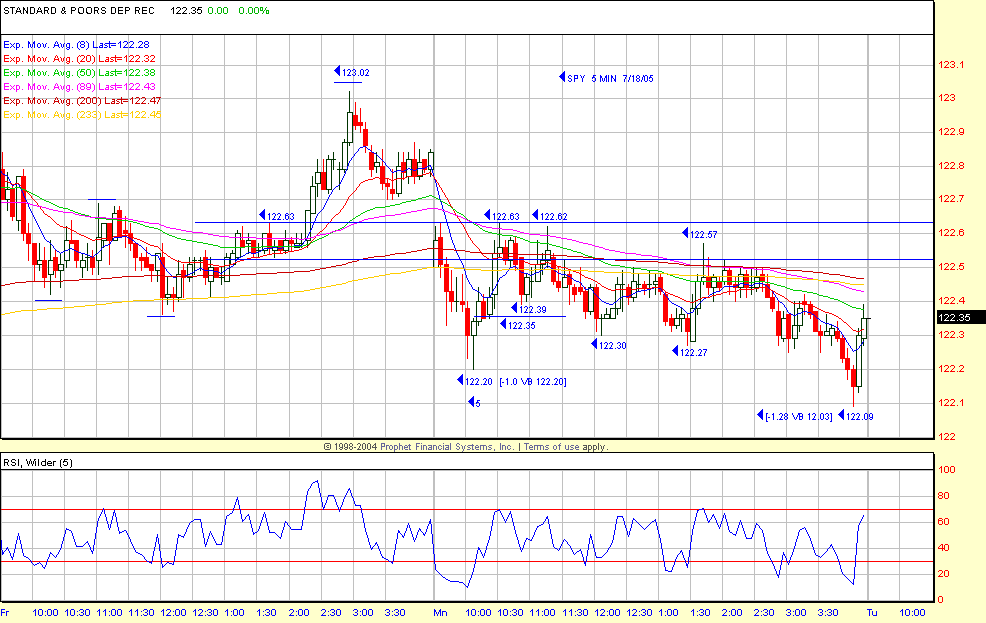
Trading was choppy yesterday
for SPX traders. I have included the SPY 5-minute chart to highlight that
action. The choices were to play the
Trap Door long after the 122.20 low, which was also the -1.0 volatility band
and/or the short side on the first retracement to 122.63, which reversed the
122.49 low of last Thursday’s
123.44 high day. If you had a
strong short side bias yesterday, the SPY traded down to 122.09 vs the -1.28
volatility band of 122.03 before closing at 122.35. If you didn’t have a strong
short side bias yesterday you got whipped around some as the SPY retraced again
to 122.62 and then 122.57, so that forced some stop decisions. Yesterday is not
what you would call daytrader friendly intraday volatility in the SPX and
suffice to say, Summer brings that kind of sideways action. The choppy index
action was not a problem, though, for individual stock traders, as there were
excellent Trap Door long trades in the energy sector, which had retraced four
days from the rally highs. The OIH declined from 108 to a 100.83 low yesterday,
with daily chart range support at 100.90 – 100.60. The OIH Trap Door entry was
above 101.14 with retry on the 9:55 AM bar which traded up to 103.25–which was
also the 240-EMA level–before reversing to close at 102.25. If you selected
Focus List stock DO, the Trap Door entry was above 51.55 which traded to 53.43
and closed at 52.95. DO made a 51.24 Trap Door low, then re-crossed the 51.34
50-day EMA at the signal bar high of 51.55. Entry was on the same 9:55 AM
bar as the OIH. Many of the other Focus List energy stocks had the same Trap
Door setups.
Â
It’s earnings season, Summer
and Thursday’s SPX 1233.16 high was the 59th day of this rally off the 04/20/05
1136.15 low, so that is enough information for traders to remain very nimble and
light at these levels.
Â
Have a good trading day.
Â
Kevin Haggerty
Â
P.S. I will be
referring to some charts at
www.thechartstore.com in the future.
Â
Â

