Analog Forming Double Bottom
Bullish technicals appear to be lining
up with bullish fundamentals in chipmaker Analog Devices.
After Tuesday’s close, the Norwood,
Mass.-based company
(
ADI |
Quote |
Chart |
News |
PowerRating) posted July 29 third-quarter operating net of 43
cents a share vs. 15 cents a year ago and breezing past analyst estimates
averaging 37 cents, according to First Call/Thomson Financial.
The company said robust demand for
computer chips that process sound and video into digital signals helped boost
sales 85% to $700.6 million.

Ahead of the news, Analog Devices
shares advanced 6 1/8 to 82 7/16, clearing the stock’s mid
level (at 77 15/16) as well as its 50-day moving average on normal
volume. That clears two tests for an abatement of overhead
supply.
Overhead supply is the amount of shares
held by investors and traders who bought at higher price levels. These weak
holders look for opportunities to end their unhappy experience with a stock. So
they are tempted to sell into rallies. Once a stock, however, has made up most
of the point loss of a recent correction and has overcome its intermediate- and
long-term moving averages, weak holders increasingly become stronger holders as
the stock’s progress wins their confidence.Â
The mid level
presents the point where the stock has made up half of the maximum point loss in
a correction. You can find a stock’s mid level by
summing the pre-correction high and the post-correction low, then dividing the
result by 2.
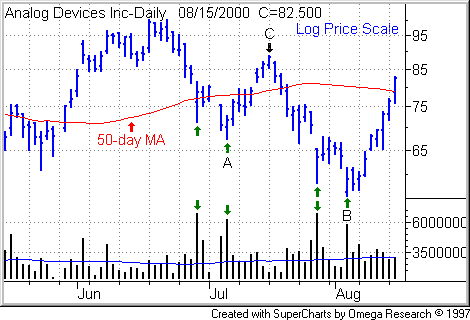
Analog Devices appears to be forming a
double-bottom
base. As you can see, the stock formed a first low (see Point
A in the above chart), followed by a second lower low (see Point
B). The two bottoms are separated by an intermediate peak (Point C).
The intermediate peak forms a pivot point in the pattern.
I also like the clear signs that
institutional investors have stepped in during sell-offs to accumulate shares at
the lows. You can see this on a number of occasions when the stock sold off,
then closed in the upper half of the session trading range on heavy volume. (See
green arrows in the chart.)
For more on interpreting volume, read
my lesson, Using
Weekly Charts To Spot Accumulation, and Greg Kuhn’s lesson, Volume
Clues.
All stocks, of course, are
speculative. On any trade, be sure to protect yourself by limiting your position
size and setting an initial stop where you will sell your buy or cover your short to cap your losses in case a position turns against you.
