Trading Range Bottom Attempt
I’m
still going to label this market a Trading Range with a bearish bias. To those investors heavily allocated to
Nasdaq stocks, though, this is a
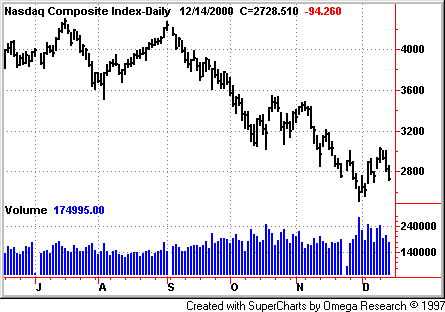
full-fledged bear market, with the Naz off nearly 50% from March highs to recent
lows. But the Dow and S&P are
still not CLEARLY signaling a bear market by declining at least 20%, and by not
declining below significant support (9700 and 1300 respectively). What is a bit frightening is that many of the top Naz stocks are still
wildly overvalued on a historical basis.
The
recent bounce off of 11/30 lows has produced two follow-through days. However, breadth on the rally remains less than impressive. If the 11/30 low is a decent enough bottom to produce a catchable rally,
breadth will pick up and the number of leading stocks breaking out of sound
bases will begin to tell the tale. Until
that happens, remain defensive.
We
are still looking for a seasonal rally to develop going into January. Greenspan has indicated a bias change toward loosening and a probable
beginning of rate CUTS over the next few months. The bond market is moving up strongly to new highs, leading stocks. BUT, we need for breadth and breakouts to kick in before getting too
excited. And so far, that is not
happening with any thing remotely resembling abundance. And there are some indicators that have not reached levels normally
associated with a major bottom. For
instance, equity fund inflows normally turn negative, but have not so far.
Theyes”> The commitment of Trader’s Report shows that large
commercials, who are usually correct on their big positions, remain heavily
short the market.
And
although we’ve seen a couple follow-through days, many of our other breadth
indicators are not yet signaling buy signals. Look for more of the following clues to a real upside reversal before
considering any strong allocation to the longside in the weeks and months ahead:
-
Up volume being 77% of total volume on at least one strong volume up
day; -
The 11-day A/D ratio moving above 1.9, meaning that advances are
trouncing declines; -
Some sort of financial shock or necessary bailout that will end the
liquidity squeeze currently under way; -
At least one O’Neil follow-through day (a major index has prices up 1% or more
on higher volume than the prior day) where volume is much stronger than the
average volume of the last 50 days (We have had two of these so far, which is a
plus and makes us look carefully for more clues of a bottom and of breadth
necessary for a decent rally); -
Clear evidence that the economy is slowing down significantly by several reports
(here, too, with recent economic data and Fed comments, this is starting to
develop); -
A clearly strong bond
market making new highs; -
Of
course, most importantly, look for a broadening of our Top RS/EPS New Highs list
to above 20 names for several days in a row, along with some clear group
leadership in breakouts of stocks on this list, and a handful of new breakouts
of four-plus-week flags or cup-and-handles in stocks clearly meeting our "upfuel"
criteria (see my 10-week trading course on TradingMarkets.com).
We now have three of
the above seven criteria being met at
a normal seasonal bottom time, with the Fed talking of easing, and the Naz
having taken a 50% haircut. Many
indicators are oversold. It would
thus not surprise us if a catchable rally takes hold from here. But until the breadth of leading stocks breaking out of sound basis
increases substantially, we simply have no way of participating. If this rally is for real, that will develop. If it is not, breadth won’t give us many trading opportunities and that
will save us from jumping into another bear-market rally.
Let’s
look at some numbers from the week. New
Highs versus New Lows on our RS/EPS lists were 16/20, 35/12, 55/6,
31/13 and
22/15, as new highs showed some dominance over new lows this week, though not
clear and substantial dominance. This
rally is striving to get its legs, but not yet showing enough strength to get
excited about. There were roughly
14 breakouts on the upside with 7 breakdowns on the downside of four-week plus
consolidations on our RS/EPS lists. However,
most importantly, there were no valid breakouts on the upside in upfuel stocks
and no valid breakdowns on the downside in downfuel stocks.
Close calls on the upside were seen in
(
TBL |
Quote |
Chart |
News |
PowerRating), but the breakout to new highs
(remember we want the new high to CLOSE above prior highs) was not on a TBBLBG;
while close calls on the downside were seen in
(
IBC |
Quote |
Chart |
News |
PowerRating) (no valid pattern),
(
IRS |
Quote |
Chart |
News |
PowerRating) (too
thin to short and not in leading group on downside) and
(
IT |
Quote |
Chart |
News |
PowerRating) (not enough volume
on breakout). The fact that close
calls were more heavily on the short side than the long-side means this market
still has some proof to go before we get too excited, although I suspect a
tradeable rally is in the process of developing here in December. A truly strong market would give us a handful or more of valid breakouts
in upfuel stocks, while a truly weak market would give us several valid
breakdowns of downfuel stocks.
Clearly,
there is not clear dominance on either the upside or the downside yet in such a
manner that would lead us to significantly increase our allocation either way. The
market is still not giving us many trading opportunities, and is therefore still
warning us to be cautious.
Our
overall allocation remains super low. We
are now around 8% long (including open profits) and 0% short for aggressive
accounts using leverage (4% long and 0% short for unleveraged, more conservative
accounts). Last week our longs
dropped an average of 4.5% (and with 17% allocation, this subtracted 0.77% from
our overall portfolio), while our one short rose 10.8% before we were stopped
out with profits (and with 7% starting allocation, this subtracted 0.75% from
our overall portfolio) giving our overall portfolio a loss of around
1.52% on the week and leaving us with around an 82.26% gain on the year (1.52%
below 83.78% equity highs) on a 12% maximum drawdown so far. Conservative investors not using leverage show about half these gains and
drawdowns. Our three steps forward
2.5 steps back snail-slow gains with relatively low volatility in our total
account continues, but we have managed to keep our gains and avoid both the
bloodshed and the volatility many other strategies have shown here, which is
actually even more important than cleaning up from the big moves up.
For
those not familiar with our long/short strategies, we suggest you review my
10-week trading course on TradingMarkets.com, as well as in my book "The
Hedge Fund Edge" and course "The Science of Trading."
Basically, we have rigorous criteria for potential long stocks that we
call "up fuel," as well as rigorous criteria for potential short
stocks that we call "down fuel." Each day we review the list of new highs on our "Top RS and EPS New
High list" published on TradingMarkets.com for breakouts of four-week or
longer flags, or of valid cup-and-handles of more than four weeks. Buy trades are taken only on valid breakouts of stocks that also meet our
up-fuel criteria. Shorts are
similarly taken only in stocks meeting our down-fuel criteria that have valid
breakdowns of four-plus-week flags or cup-and-handles on the downside. We continue to buy new signals and sell short new short signals until our
portfolio is 100% long and 100% short (less aggressive investors stop at 50%
long and 50% short). We’ve
been effectively defensive ever since, and continue to be.
Upside
breakouts meeting up-fuel criteria (and still open positions) so far this year
are: Mid-Atlantic Medical Services (MME)
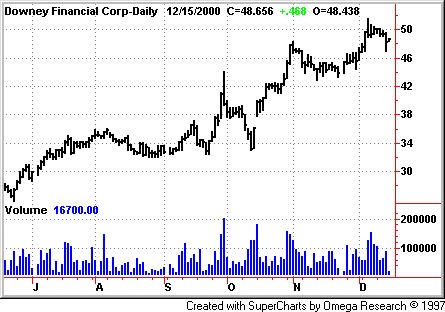
@16.56 — took profits on 19 trailing stop; Downey Financial (DSL)
@45.25 w/45.5 ops; and last week we had no valid pattern breakouts up in stocks
meeting our upfuel criteria (see 10-week trading course). The
average gain in these stocks from breakout points of entry to Wednesday’s close
is 68%, substantially outperforming the
Nasdaq, Dow and S&P for the year to
date. Continue to watch our NH list and buy flags or cup-and-handle
breakouts in NH’s meeting our upfuel criteria — but continue to add just two
per week.

On
the downside this year, we’ve had breakdowns from flags (one can use a down
cup-and-handle here as well) in stocks meeting our down-fuel criteria (and still
open positions) in: Global Crossing (GX)
@21.44 — took profits on 16 trailing stop; and this last week we had no valid pattern breakdowns in
stocks meeting our down-fuel criteria (see 10-week trading course). These
shorts are down over 59% from breakdown levels on average so far this year
(before current prices or exits). Continue to watch our NL list daily and to
short any stock meeting our down-fuel criteria (see 10-week trading course)
breaking down out of a downward flag or down up-and-handle. Here, too, remain
cautious by only adding two shorts in a week.
The
Naz has broken critical support at 3000 and is just trying to test that level on
the upside now. There HAVE been
some follow-through days. There is
a glimpse of hope on the Fed easing, the economy is softening, and bonds are
strong. We DO expect a seasonal low
this month. But SO FAR, the most
important component of any rally — trading opportunities and breadth — are not yet
in full gear. WAIT until they are. When you don’t get killed by the bear moves, you can wait patiently until
it is safe to enter before getting in. DON’T
WORRY ABOUT MISSING THE BULL MOVE. If
it develops, we will be late, but will catch up by selecting the leaders that are
breaking out of solid patterns. The
name of the game is to make money and defend gains, not to pick bottoms and
tops. Therefore, remember to
let market action be your guide. Only
when our opportunities grow to become abundant will we be able to get more
excited about moving our long allocation or short allocation up to more
aggressive levels. Let’s stick
religiously with our strategy and let it tell us how aggressively or defensively
to allocate and to what vehicles on what side of the market, since the strategy
is doing so well in this market environment.

