Unmasking Generals With Weekly Charts
The Generals hide their battle plans
when they launch a campaign. The institutions spread out their orders over days
and weeks when they accumulate a position. That’s why I run my target stocks
through weekly as well as daily charts.Â
Clever trading sometimes can mask the
heavy buying of deep-pocket institutions like mutual funds and insurers. But
aggregating price changes and volume levels on a weekly basis can help you see
through this camouflage.Â
AFLAC
(
AFL |
Quote |
Chart |
News |
PowerRating), the largest
supplemental health insurer in the U.S. and Japan, Tuesday reported operating
net of 59 cents a share in the second quarter vs. 47 cents a year ago. The
results came in a penny above estimates, according to First Call/Thomson
Financial.

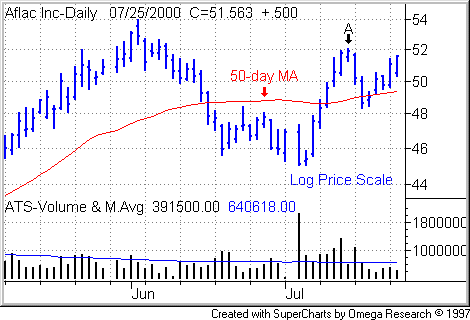
On a daily chart, the AFLEC shares
have traced a nice correction-recovery pattern, but the volume clues appear
mixed. We don’t see a predominance of accumulation days
in which the stock forged ahead on an increase in volume. Instead, you also can
see opposing distribution days, sessions of
a declining prices on rising volume.
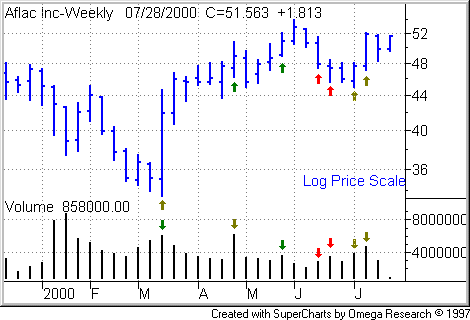
Now check out the following weekly
chart.
 Â
Â
Notice how the accumulation
weeks (see green arrows) outnumber the distribution
weeks (marked by red arrows) since the stock came off the lows five
to two. You could even argue that the last distribution week, ending Friday June
23, shows signs of accumulation within the down move. The stock ended in the
upper half of the range and close to the prior week close.
This does not mean that I’d ignore the
distributional signs in the daily chart. To stack the odds in your favor, I’d
insist on strong dailiy volume on any breakouts, such as a price move above the
most resistance point, AFLAC’s intraday high of 52 on July 14 (see Point
A on the daily chart).
All stocks, of course, are speculative. On any trade, be sure to protect yourself by setting an initial stop where you will sell your buy or cover your short to cap your losses in case a position turns against you.
For more on using weekly charts, check
out my tutorial,
Weekly Charts to Spot Accumulation.
