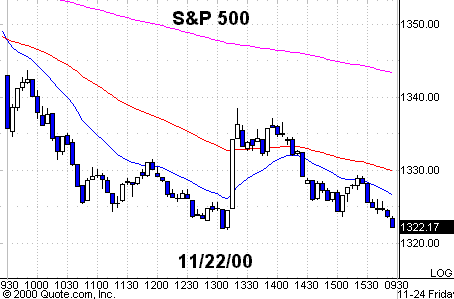
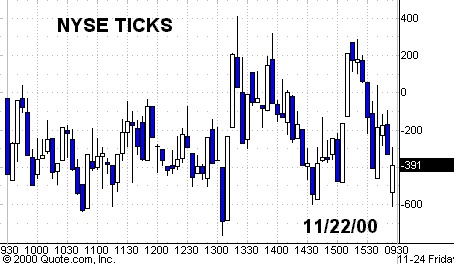
Game Day Liquidity
Wednesday
morning, we expected a “Florida” reaction on the opening.
The possible trading scenario that I outlined was “Gap Down, Trap Doors,
1.5 – 2 volatility-band moves, and if the contra move takes stocks above the
opening, be ready to reverse and go short with the opening as a pivot. By
preparing in advance, you are ready to act and take much of the emotion out of
your trading which is positive.” Now let’s look at the trading day and
recount what happened, using the Nasdaq 100
(
NDX |
Quote |
Chart |
News |
PowerRating) as the prime example.
1. The NDX had a Gap Down
opening of -2% to 2738.39.
2. The Gap opening was below Tuesday’s low of 2745.70 and the 11/13 low of
2742.47.
3. The NDX then reversed both lows and rallied +2.5% in just four bars to the
intraday high of 2806.33. There were multiple Trap Door opportunities.Â
4. The highs were followed by Opening Reversals to the downside in many key
stocks and they had multipoint moves.
Key point: As you’ve heard
me say before, the sell side professional will take the stocks down hard and
fast if possible so as to take on volume at a much lower price and where there
might be buyers. If they bleed it down, they end up with too much volume at
higher prices. The most profitable period for professionals is the opening
period, thanks to the futures and the retail emotion that persists on
openings.Â
Summing it up, you had a
Gap Down opening, Reversal of Lows, Trap Doors and then ORs to the downside all
in the first hour. From there, you got some volatility-band action with two
different rallies of +1.7% and +2%. You had the trading plan and the necessary
tools you have learned to participate in some part of that action. It is just
the basics of understanding how the professionals trade, identifying the buying
and/or selling pressure, in addition to the market dynamics at the time of the
trade.
A quick review of framing
the NDX 100 from the 10/98 low to current alert levels is as follows: 2496 is
the .618 retracement level and is really the key zone. Using 2% on either side,
you get a zone of 2447-2545. The first decline from 4816 took the NDX down to
2897, which was the .50 retracement level. From 2897, it rallied 43% to 4147,
which was the .618 RT level between 2897 and 4816. So far, very geometric.
If you look at this as a
Leg C of the A-B-C correction, you have the following alert zones:
1. 2638, which is the .786
extension of Leg A from 4816-2897.
2. The .618 zone that I mentioned at 2496 is only -6.4% from the close the other
day, which is a day’s work.
3. 2408 is the basic Gann 50% retracement which is just one half of 4816. Next,
you have 2228. If Leg C’s decline is the same as Leg A, which is 1919 points,
you subtract the 1919 Leg A from 4147 and that’s how you come up with that
number.
4. 1710 is the 1.27 extension of Leg A, and that’s subtracted from 4147 — let’s
hope we don’t get it.
face=”arial, helvetica”>(December Futures) | ||
Fair | size=2>Buy | size=2>Sell |
6.40 | 7.65 | 5.20 |
Pattern
Setups
Because of the liquidity factor today,
intraday setups will prevail so be careful in size because the chosen ones will
be all over the board but will give you range. Other stocks to look at are
(
GPS |
Quote |
Chart |
News |
PowerRating),
(
WAG |
Quote |
Chart |
News |
PowerRating),
(
CVS |
Quote |
Chart |
News |
PowerRating),
(
GENZ |
Quote |
Chart |
News |
PowerRating),
(
LIZ |
Quote |
Chart |
News |
PowerRating),
(
EDS |
Quote |
Chart |
News |
PowerRating),
(
SGP |
Quote |
Chart |
News |
PowerRating),
(
PG |
Quote |
Chart |
News |
PowerRating)
and
(
CSC |
Quote |
Chart |
News |
PowerRating).
 Have a great trading day.


