Waiting For The Bases
Do we have a bottom? For the
intermediate-term momentum trader, the question is academic if there are no
stocks to buy. And right now, I see scant evidence of high 12-month relative
strength stocks nearing the completion of proper bases.
If you trade momentum stocks for the
intermediate term, let the market build stocks meeting your technical profile:
Sound bases of at least five weeks in length (longer is better), clear signs of
accumulation, share-price tightening before crossing above your pivot point.
Don’t try to force things. Â
Let’s look at a couple of Friday’s
news movers.Â
After Thursday’s close, networking
chip maker PMC-Sierra
(
PMCS |
Quote |
Chart |
News |
PowerRating) reported Q3 profits tripled, boosted by strong
sales to manufacturers of networking gear. The San Francisco-based company
predicted Q4 sales will rise at least 15% percent sequentially. The company had
a 12-month TradingMarkets relative
strength score of 91 as of Thursday’s close.

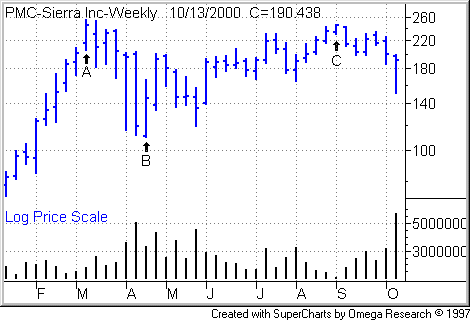
Shares closed up 32 to 190 7/16 on
heavy volume. However, the stock has a ways to go before it’s in position to
trigger a buy signal for the intermediate-term trade. Take a step back from the
daily activity and look at the weekly
chart above — the stock is still trading down for the week and below its mid-level of 183 1/8. The accumulation for this week was very powerful
and promising for the short-term trader. But intermediate-term traders need more
price progress.
To sidestep overhead supply, I also
insist that a stock trade above its 50- and 200-day moving averages. In PMC-Sierra’s
case, I might use resistance at 246 1/4 (Point C)
as a pivot if the stock broke above that threshold on active trade. If the stock
drifted above that level on light trade, I would probably hold back and look for
the stock to form a handle between 246 1/4 and the stock’s all-time high of 255
1/2, or form a handle slightly above the all-time high.
For long trades, I shun stocks that
are priced below their mid-levels on the assumption that they are weighed down
by too much overhead supply. Overhead supply is the amount of shares in
the hands of shareholders with paper losses. These buyers and weak
holders tend to look for exits and sell into rallies. Once you buy, you want
your fellow shareholders to hold tight, obligating future buyers to bid up the
stock in order to entice more supply to market.
You can find a stock’s mid-level by
summing its pre-correction high (see Point A
in the above chart) and its post-correction low (Point
B), then dividing the
result by 2.
After Thursday’s close, Juniper
Networks
(
JNPR |
Quote |
Chart |
News |
PowerRating) reported income of 17 cents a share in the third quarter, excluding
costs for deferred compensation and goodwill. That compares to a loss of a penny
in the year-ago period and estimates averaging 9 cents, according to First
Call/Thomson Financial. Revenues soared to $201.2 million from $29.6 million.
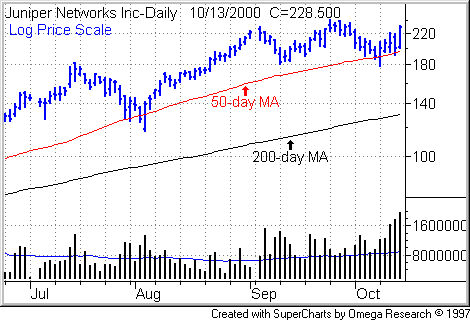
Those are phenomenal results. Juniper
also holds a 12-month RS score of 96 as of Thursday’s close. But the consolidation
zone is still a tad short — three months — to be called a base, as you can see
in the following daily chart. My minimum for
a base is typically five weeks.

All stocks, of course, are risky. In
any new trade, reduce your risk by limiting your position size and setting a
protective price stop where you will sell your new buy or cover your short in
case the market turns against you. For an introduction to combining price stops
with position sizing, see my lesson,
Risky Business. For further treatment of these and related topics,
you’ll see extensive lessons in the Money
Management area of TradingMarkets’ Stocks Education section.
