What Might Happen If The War Goes Well
Geopolitical gyrations continue to dominate the markets. Today’s
global stock explosion and rally in the dollar, accompanied by gold and bonds
taking a hit, is likely a miniature picture of what will happen if the war goes
well. Stocks were very oversold, bonds are overvalued, overbought, and
over-owned, and the dollar is wildly oversold, sentiment overdone, and heavily
shorted. So these markets are vulnerable to huge gyrations, which the news is
likely to oblige, quite possibly in both directions. We urge investors to
carefully monitor war news and stay out of this market fray for the most part.Â
There is further evidence of
substantial US and UK special force movements late this week and that
communications fiber optic zones are being taken out with bombs in a host of
strategic regions within Iraq (next will come bombardment of artillery and
missiles and then finally tanks — such softening via bombing could take a
week). It appears that most of Saddam’s troops will be enclosed in an Iron
triangle with a radius of around 50 km from Tikrit to Baghdad to Ar Ramadi. Iraqi
troops are also stationed to defend the Northern oilfields that Turkish troops
would take.Â
A key to the conflict will be
whether Saddam’s coalition of terrorists and troops will torch the areas he has
ordered them to, once American troops land:Â Northern oil fields, Mosul, Kirkuk,
An Njaf, Ur Chaldees, and Basrah. Another key point to watch is whether Saddam
allows his elite armored divisions into Baghdad proper. If he does, he risks
them staging a coup and delivering Baghdad to the Americans with Saddam and his
elite being the main and only major casualty of the war;Â if he does not allow
them into Baghdad they are an easy target for elimination from American
warplanes and missiles.Â
There have also been
suggestions that Chirac will try and instigate a more active prevention of war
if the US doesn’t move quickly. Special forces trying to secure the two major
bridges on the Euphrates are advancing and may even face their first direct
Iraqi conflict as soon as this weekend. We urge investors to stay alert to war
activities via many excellent intelligence services on the web.
In the meantime, the markets
are a volatile sea of whipsaws. Could this be the important bottom that is
followed by a successful US invasion and leads to a double-digit rally? It is
certainly possible, but investors should wait for more reliable signals before
committing anything more than speculative play capital. The follow-through day
of today needs to be matched by more positive breadth action soon.
Therefore investors should keep
a mix of cash in various currencies (Everbank.com) and sit on their hands mostly
until the global showdown develops some clarity.Â
Once war-jitters recede and the
outlook is less risk-prone, we believe the market will launch a strong and more
sustained move — though we don’t yet know in which direction.  Watch and wait
for volume, breadth, leadership, and follow-through to
emerge in one direction before allocating serious capital to either the
short or long side. Caution is still advised strongly.Â
Since
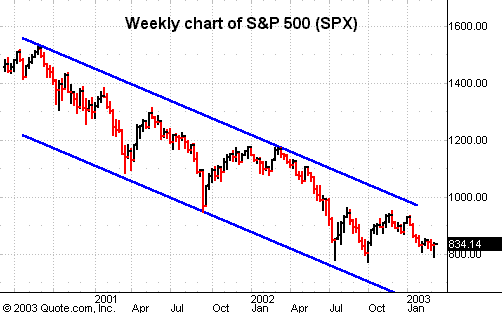
March 2000 the world index is down over 45%, the S&P over 48%, the
IBD mutual fund index is down over 62%, and the Nasdaq has
crashed over 76%. Meanwhile since March 2000 the long/short strategy we
summarize and follow-up each week in this column has made more than 39% on a
worst drawdown of under 6%. While
this performance is certainly underperforming our long-term growth rate, and it
is hardly thrilling to have been so heavily in cash since March of 2000, we have
managed to eke out gains with very low risk in a very dangerous market
environment where 9 out of 10 traders have been big losers.Â

Our official model portfolio
overall allocation remains VERY DEFENSIVE. We’re now 84% in T-bills awaiting
new opportunities, with two sole long positions. Our
model portfolio followed up weekly in this column was up 41% in 1999, up 82% in
2000, up 16.5% in 2001, and up 7.58% in 2002, an average annual gain of over 36%
— all on a worst drawdown of around 12%.  We’re
now up 0.1% for the year 2003.  Â
To our daily
Top RS/EPS New Highs list the entire rally from the 7/24 and then October
lows never even registered on the radar screen having mustered up just
ONE solid week of consistent +20 or higher readings
since 7/24. Bottom RS/EPS New Lows are sporadically rising above 20 new lows
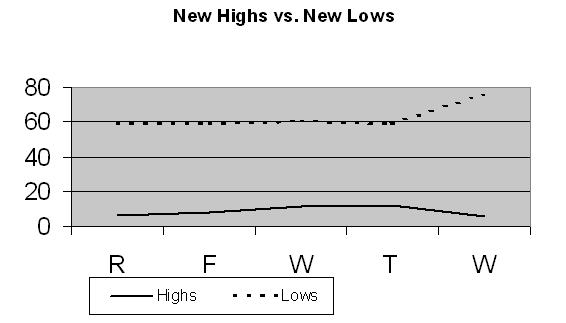
daily, signaling a downward bias that is not yet gaining strong breadth. We had
readings of 6, 8, 11, 12, and 5 new highs last week in our Top RS/EPS New Highs
list, accompanied by 7 breakouts of a 4+ week range and one close call
(
EGN |
Quote |
Chart |
News |
PowerRating). Bottom
RS/EPS New Lows last week showed readings of 59, 59, 60, 59, and 76, but were
accompanied by just 16 breakdowns of 4+ week patterns without any clear close
call on the short side. The breadth on the short-side was reversed with today’s
follow-through action. The bottom-line is that highly reliable low risk
opportunities remain scarce in this uncertain environment.

For those not familiar with our
long/short strategies, we suggest you review my book
The Hedge Fund Edge, my course “The Science of Trading,”
my video seminar, where I discuss many new techniques, and my latest
educational product, and
interactive training module. Basically, we have rigorous criteria for
potential long stocks that we call “up-fuel,” as well as rigorous criteria for
potential short stocks that we call “down-fuel.” Each day we review the list of
new highs on our “Top RS and EPS New High List” published on TradingMarkets.com
for breakouts of four-week or longer flags, or of valid cup-and-handles of more
than four weeks. Buy trades are taken only on valid breakouts of stocks that
also meet our up-fuel criteria.
Shorts are similarly taken only in stocks meeting our down-fuel criteria that
have valid breakdowns of four-plus-week flags or cup and handles on the
downside. In the US market, continue to only buy or short stocks in leading or
lagging industries according to our group and sub-group new high and low lists.
We continue to buy new signals and sell short new short signals until our
portfolio is 100% long and 100% short (less aggressive investors stop at 50%
long and 50% short). In early March of 2000, we took half-profits on nearly all
positions and lightened up considerably as a sea change in the
new-economy/old-economy theme appeared to be upon us. We’ve been effectively
defensive ever since.
Upside breakouts meeting
up-fuel criteria (and still open positions) so far this year are:
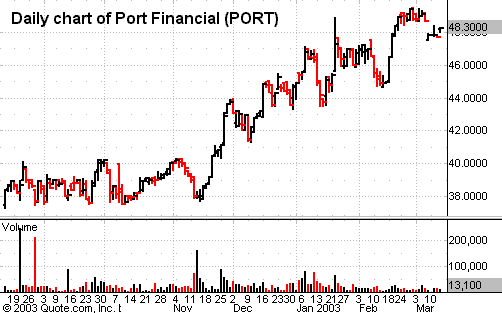
Port Financial
(
PORT |
Quote |
Chart |
News |
PowerRating) @40.99 (47.7)- w/Â a
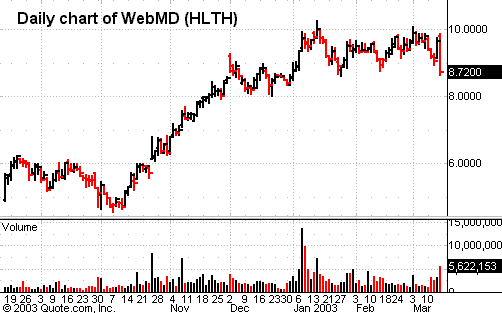
44.5 ops to lock in profits, and WebMD
(
HLTH |
Quote |
Chart |
News |
PowerRating) @9.44 (9.06) w/ an 8.5 ops. Continue to watch our NH list and buy
flags or cup-and-handle breakouts in NH’s meeting our up-fuel criteria — but be
sure to only add names that are in leading groups, and now only add two trades
per week once again until leadership and follow-through improve.Â


On the short side this year,
we’ve had breakdowns from flags (one can use a down cup-and-handle here as well)
in stocks meeting our down-fuel criteria (and still open positions) in:
NONE. Continue to watch our NL list daily and to
short any stock meeting our down-fuel criteria (see
interactive training module) breaking down out of a downward flag or down
cup-and-handle that is in a leading group to the downside but only add up to two
in any week (and only in the weakest groups) until we get better breadth numbers
on the downside and better leadership.
Investors and traders should be
on survival strategy here. Sure there will be BIG
winners from those investors who pick the right side of the war to bet on. But
this is not the kind of reliable situation a true investor is looking for, in my
opinion. Stay heavily in cash and aware of the risks, and when there is a
clearer path toward resolution that is signaled by breadth, follow-through, and
leadership, then investment strategies will pay off big.
Mark Boucher
