Keep A Heads Up For These Stocks Today And Monday
Yesterday’s final tally for the major indices with the SPX
(
$SPX.X |
Quote |
Chart |
News |
PowerRating)
-0.2%, Dow
(
$INDU |
Quote |
Chart |
News |
PowerRating)
-0.3%, and Nasdaq
(
$COMPQ |
Quote |
Chart |
News |
PowerRating) -0.2% doesn’t tell you the profitable
daytrading opportunity that all of you 1,2,3 and RST traders had, provided you
are able to pull the trigger on reversal patterns at key levels. Overall NYSE
volume was relatively light at 1.2 billion, the volume ratio neutral at 46, as
was breadth at +192.
The early emotion took
the major indices to their intraday lows by 10:00 a.m. ET, and then the trend up
rally started, right up to the intraday highs around 2:30 p.m. For example, the
Dow, which had closed at 8234 on Wednesday, knifed down after the opening to the
8104 intraday low on the 10:05 a.m. bar, which was a signal bar because it was
the first reversal bar of the day and it closed at the top of its range and
above the midpoint of the previous bar and close. It was also at the 10:00 a.m.
key program time frame, which you should be familiar with from previous
commentary. 8104 was the exact 2.24 Fib extension of the last leg up on
Wednesday afternoon. 8100 is the .382 retracement from the 8522 rally high,
which started at the 7417 low on March 12. Based on this sequence, you were
correct to take entry above the signal bar high of 8115, and that was also your
RST entry.
If you aren’t familiar
with any of this, but had the
1,2,3 module, you soon got your chance. A 1,2,3 higher bottom set up with
entry above either 8135 or 8132. If you look at yesterday’s five-minute chart,
you will see the two possibilities. The Dow traded up to an intraday high of
8252 before fading to close at 8194. Final score on the day was -0.3% for the
Dow and +1.7% from initial entry above the signal bar high to 8252. There were
also several pullbacks along the way that you could have taken advantage of.
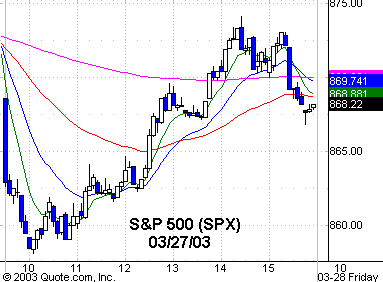
The SPX obviously had the
same pattern setups. The intraday 858.09 low was on the same 10:05 a.m. bar.
858.13 was the 1.0 volatility band, which comes into play often. (See the
March 26 commentary.) The initial entry presented to you was above the
859.06 signal bar high, and the 1,2,3 bottom entry was above 860.14. 857 was the
2.0 Fib extension of Wednesday afternoon’s last leg up. The .382 Fib level was
below that at 855, which was also the 2.24 Fib extension.
Needless to say, when the
major indices set up at key sequence levels, so do many of the big cap stocks
that pattern up well, which is not the same for small and mid cap stocks that
can be pushed around on light volume.
The early futures are
red, but you want to be aware of the possibility for a first-quarter-ending
jiggle. The SPX closed 2002 at 879.82 and is -1.3% on the year, closing
yesterday at 868.52. On the other hand, the
(
QQQ |
Quote |
Chart |
News |
PowerRating)s closed 2002 at 24.37 and
are +8.3% for the year, closing at 26.39 yesterday. This tells you to be heads
up on the best-performing NDX stocks today and Monday in case of a jiggle.
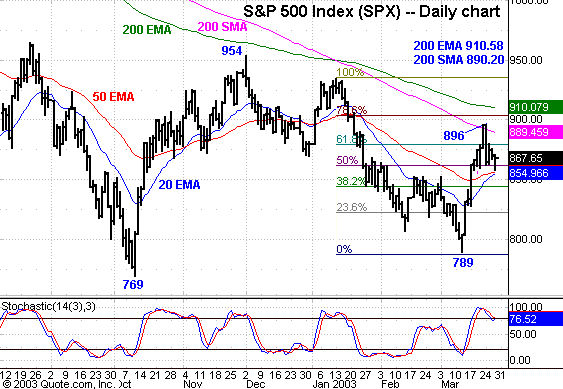
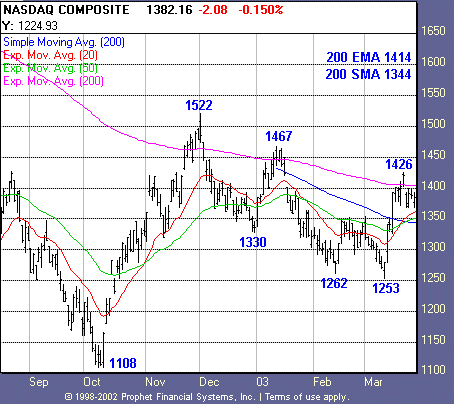
I have included a few
charts in today’s commentary which highlight some levels and moving averages.
When the 200-day moving averages are in play, as they are now, you want to be
aware of both the SMA and EMA because there can be a significant difference in
volatile markets, such as now. You will see that the SPX stalled at the 200-day
SMA zone and is pulling back to its 50-day EMA, while the Nasdaq, which has been
stronger, burst through its 200-day SMA on a wide-range bar, and even traded
above its current 200-day EMA of 1414.36 to a 1426 high before pulling back. The
Nasdaq chart today has an incorrect 200-day EMA on it, as I think TradingMarkets
used Qcharts. Other vendors have the 200-day EMA at 1414. This sometimes happens
depending on when the vendor started the calculation for the EMA average. Always
check a few different vendors.
The key point is they are
just awareness levels where price action can provide some potential setups,
especially the 200-day EMA, which is a key psychological average. I have also
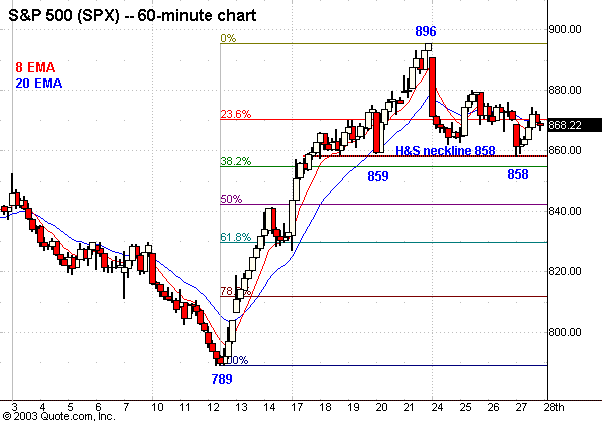
included the 60-minute SPX chart, which frames the current rally from 789 to the
895.90 high. The SPX closed at 868.52 after declining from the 874.15 intraday
high on a 1,2,3 lower top pattern, but it was late in the day. The 1,2,3 trend
short entry coincidentally was below our much-used 870 pivot level.
Have a good trading day.


Five-minute chart of
Tuesday’s SPX with 8-, 20-,
60- and 260-period
EMAs
