Bear Market Lesson
Markets can only move three ways: up, sideways and down. The technical
historians tell us that the market for equities when viewed over time has a
definite upward bias for two-thirds of the time and declines the other
one-third.
I believe that in order to maximize returns, you should play both sides of
the market, long and short. It is a fact that stocks decline faster than they
advance. This is probably because there is only one reason you buy stock —
because you expect it to go up. There are many reason why people sell stocks, to
raise funds which can be used for various personal reasons, in addition to taking
profits.
If you adhere to proper risk management, the risks are similar whether you
are long or short. This lesson is meant to give you an overall framework for
playing the short side of the market. It will not cover how to play the long
side in a bear market, which can also enhance returns, but I will visit that
subject in a future lesson.
Here, I will outline the technical framework to short stocks with the trend,
which has the highest probability of success, and the best reward-to-risk.
There are many common mistakes that many short side traders make. The most
detrimental to your pocketbook is selling a stock short because of fundamental
overvaluation without confirmation of a declining primary trend for both the
market and the stock. I have seen many short hedge funds go out of business
because their egos got in the way and failed to recognize a change in the
primary trend before shorting. They might have thought that the PE was too high,
the stock had advanced too far too fast, or the fad wouldn’t last.
When there are many egos involved that think a company will fail, it means
there will be a very large short interest relative to its average daily volume.
These stocks will command much media attention and chatroom rumors.
The problem with this fundamental approach is that you can be absolutely
correct about the negative fundamental aspects, but dead wrong on your timing
and get blown out of your position at levels that are far above your stop-loss
buy order. We have just witnessed this countless times in the parabolic bubble
that has since collapsed and put us in a primary bear market. Many of those egos
that shorted the Internet and technology stocks found out the hard way that
overvalued can keep getting overvalued, and they didn’t have the financial
staying power to wait for the inevitable collapse of the bubble.
For this very reason, I feel very strongly that it is better to use option
strategies when shorting the market or individual stocks. It might be buying
in-the-money puts or different kinds of bear spreads, including put ratio
backspreads. This also leads to better risk management because of the defined
risk and is also a much less stressful way to trade. Get yourself an option
education and deal with an experienced option execution firm.
Regardless of whether you use options or not, you will be more successful by
shorting stocks in downtrends that retrace to a declining moving average or from
continuation short patterns like flags, triangles, consolidations, etc.
Key Points For Short Sellers
- Bulls live above a rising 30-week/200-day EMA, and bears live below.
This simply means that the highest probability is to sell short in a
declining primary trend and get into your trade as early in the declining
trend as you recognize it. - Determine the primary trend of the market and the stock.
You can use a weekly chart with 10-week and 30-week EMAs, a monthly chart
with a 12-month EMA or a daily chart with 50- and 200-day EMAs. It is better
to short a declining stock in a bear market. Don’t short a stock in a strong
group. - Ideal short candidates are stocks rising in price with weakening
technicals (RSI, money flow, stochastics) that show a negative divergence
and have very little short interest.These are accidents waiting to happen. You should be looking for the
longer-term EMAs starting to go sideways or rolling over, then begin to
decline. - Trading with the Trend
You should be selling short the retracement to declining MAs, in addition to
taking advantage of continuation patterns in the direction of the declining
primary trend.You make the same trade preparation regardless of whether it’s a position
trade or a day trade. After a retracement to a moving average, you are
looking for a reversal pattern entry below the low of the previous day’s low or
else a breakout from a continuation pattern in the direction of the trend,
which should be down. Intraday chart patterns should also be used for entry. - Utilizing Buy Stops
After you short it, immediately put a buy stop order in to cover it,
which takes the emotional decision process out of the trade. If a logical MA
or swing point stop is too far away, then use a money stop or a set
percentage stop. - Weak stocks in the weakest groups usually result in the most pleasant
surprises for the short seller. - Reward to Risk
"You must always remember to manage the money, not the analysis."
When you short a retracement to a declining longer-term moving average with
a buy stop 1%-2% above the MA, you have the potential of many times
that on the reward side.Since the 1553 top in the SPX, there have been three major retracements to a
declining 30-week EMA. The rewards after those shorting opportunities have
been 15%, 22% and 28%. That was the extent of each decline before another
move back to the 30-week EMA.The Key Point is that you traded with the trend risking 1%-2% to make a much
bigger percentage return on the down move in the direction of the trend. You
didn’t have to catch much of each decline to have a high
reward-to-risk ratio, which is what the game is all about.
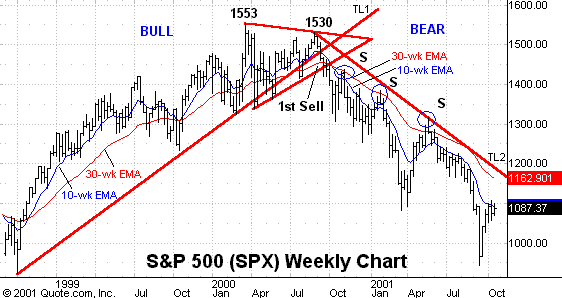
- This chart depicts the bull and bear trends, so you can see that the game
is easier when there is a primary trend. A trading-range market is more
difficult to trade. - The SPX formed a triangle after the 1553 top and the RT to 1530, which is
a 1 2 3 lower top pattern. As this triangle played out sideways, the 30-week
EMA started to roll over. - The first sale can be made breaking out of the triangle and below the
30-week EMA. It had already taken out the trendline (TL1) after a 1 2 3
lower top RT at 1530. Although it’s not shown on the chart, there was a
major negative divergence in RSI when the 1553 final top was made. Having
seen this, you were ready to play the b/o from the triangle below the
30-week EMA. - Trendline 2 (TL2) is the bear market trend we are still in, and I marked
the retracement short opportunities at the 30-week EMA. As you can see on
this last dive down, since May, the SPX is fighting the 10-week EMA, with
both the 10-week and the 30-week pointing straight down. - This makes any trend decision on longer-term investments very evident. You
don’t need any advice from the empty suits or your broker to discern the
primary trend. - I would also point out that at the final top in the NDX at 4816 there was
also a major divergence in RSI, confirming the SPX.
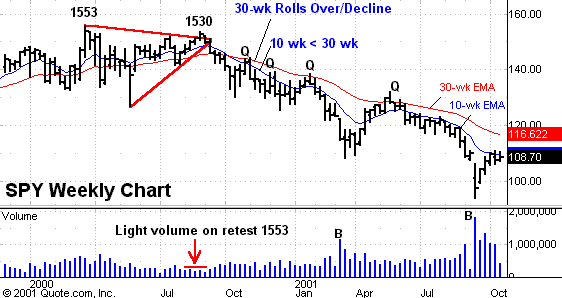
This is a weekly chart of the SPYs which gives you more clarity on the RT to
the 30-week EMA. I have labeled the top and a test of the top with the SPX
numbers 1553 and 1530, but the actual chart is for the SPYs.
Note the light volume on the 1530 lower top and the blow off volume on the
April and September lows. All of the retracements are circled.
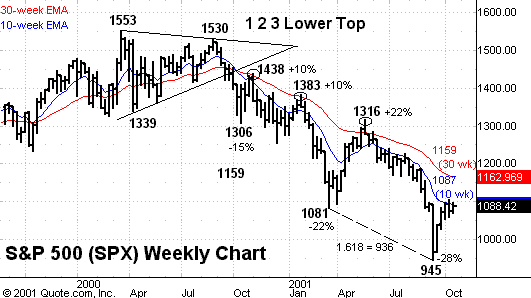
This chart points out the favorable reward to risk of shorting
retracements to the 30-week EMA in a primary downtrend. You place that stop
1%-2% above the MA, and you can see the potential rewards.
You follow the trade down by lowering your stops, but make sure
you give it enough room because rallies in bear markets are sharp.
Many of the down legs end at Fibonacci RT levels and/or Fib
extensions in conjunction with oversold indicators at extremes. There are ways
to play both ways in the trend, but the scope of this lesson is just on the
short side.
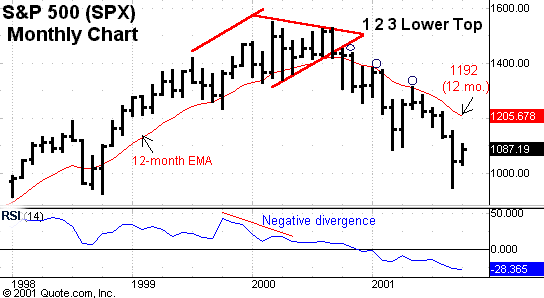
This chart with the 12-month EMA, which is the best longer-term
trend MA indicator as tested by Colby & Meyers, gives you a clearer picture
of the bull and bear trends.
You see the negative divergence in RSI, the triangle b/o with
the rolling over of the 12-month EMA and subsequent decline, in addition to the
RTs back to the 12-month EMA.
Always keep this chart on your desk and update it because it can
prevent you from making any major mistakes on your longer-term money.
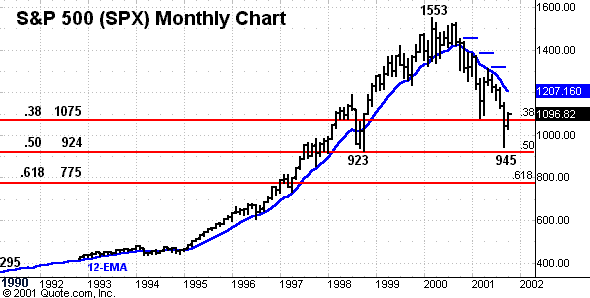
Same SPX monthly with alert levels using the 1990 bear market
low is the base. This type of chart is very useful regarding potential covers
and contra-trend trades.
For you Gann followers, when you divide 1553 by 2, you get 776, which is in conjunction with the .618 level. Let’s hope we don’t get to
that level.
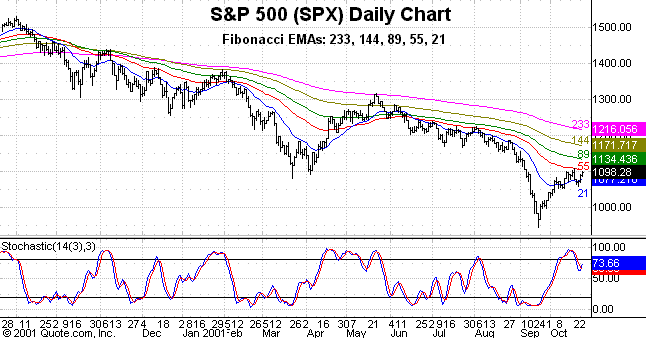
The most common moving averages used to depict trends are the 20, 50 and 200,
so we must be aware of them, both simple and exponential. If it’s an extremely
volatile stock, there can be a significant difference, so check both the SMA and
EMA.
Stocks and markets have there own rhythm and cycle periods, and I will always
check with a Fibonacci daily overlay of the 21, 55, 89, 144 and 233 daily EMAs.
When the vehicle you’re trading is in sync with the Fibonacci EMAs, it is a high
probability trade location with good reward to risk. (The 34 EMA is not used.)
-
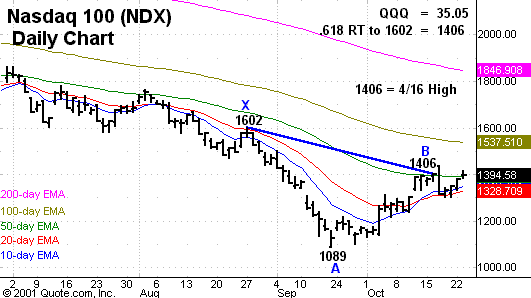
The NDX daily chart (chart 7) points out the 1406 .618 RT to
the 1602 high. Remember, this is a bear market RT to the 50-day EMA in
conjunction with a Fib RT.This 1406 alert zone you knew in advance and should have been prepared to
look for intraday short setups at this alert zone. This is an example of
combining position trading with a daytrade. -
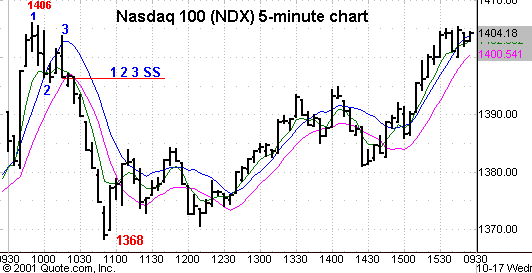
Chart 8 (five-minute) shows you the RT to 1406 and the
following 1 2 3 lower top short setup that followed. This was an excellent
daytrade using the futures or the QQQs whose .618 RT was 35.05, which was
its exact top before the 1 2 3 setup. -
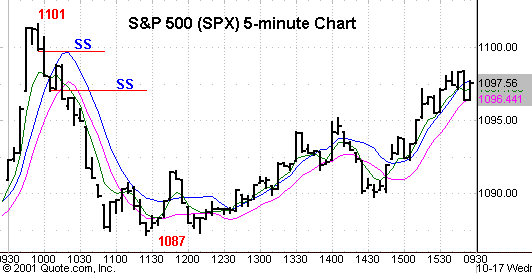
Chart 9 (five-minute) shows the same kind of setup on the
SPX. The .618 RT was 1094, and the 50-day EMA was 1101.
Note: The Fib numbers are just alert zones. These charts just
happened to hit the exact number, so be looking for pattern setups in the zone
around the number.
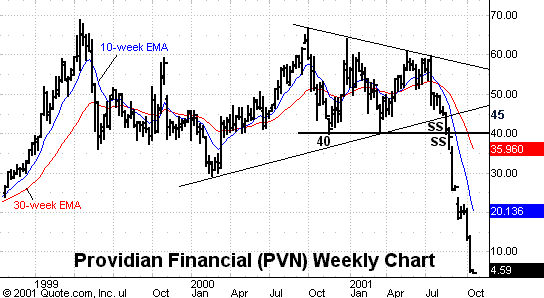
This chart is an example of the negative surprises that most
often happen when a stock is trading below all of its declining moving averages.
This chart of Providian Financial depicts a large descending
triangle with the first b/o at the 45 level, which was below both declining
10-week and 30-week EMAs. The 10-week EMA is also < 30-week EMA. The story
was credit card weakness/bad debts by the consumer and the accelerated move was
on. The next good entry was a continuation b/o below 40.
This turned out to be a windfall trade and you can’t know in
advance that
will happen. You would be surprised how lucky you can get by following some
basic guidelines on shorting stocks.
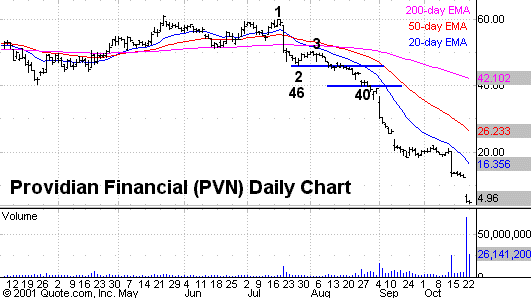
This is a different look at PVN on a daily chart which should
always be used in conjunction with your longer-term weekly and monthly charts.
A basic 1 2 3 short setup below declining 10 and 50 EMAs, while
the 200 was rolling over. (I prefer to use the 30-week EMA.) Entry was below the
2 point low of 46.
The next entry was below 40, which has more significance when
you view the weekly chart.
"You got lucky" below 40, "Bud."
Summary
This lesson is meant to demonstrate high probability technical
short selling patterns in a bear market where the primary trade is down.
It is assumed that the reader has acquired the knowledge of all
the risks associated with short-selling, such as margin, borrowing stock, etc.,
in previous educational lessons on short selling.
Keep it basic and short the continuation patterns and
retracements when the primary trend is down and your odds for success will be
much higher.
