Slim Jims Again
The bell
curve chart formations in the
S&P 500
(
SPX |
Quote |
Chart |
News |
PowerRating)
continued yesterday with the
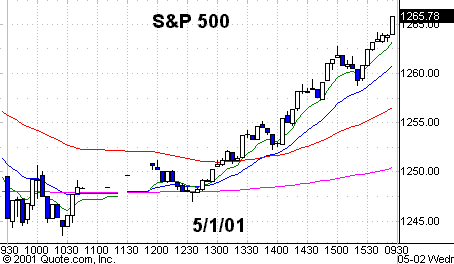
afternoon straight up trend. The index had opened down, then chopped sideways
before exploding after 1 p.m. to close at 1266.44, up 22 points from the
intraday low of 1244.46.Â
There has been constant
program acceleration both ways into the month end and now the first days of the
new month. Just to highlight this, the SPX went from a 1241 low at 2:35 p.m.
last Friday to a 1269 high by 11:35 a.m. Monday morning. Next came the
program-accelerated knife down to 1244 by 3 p.m. Monday afternoon, closing at
1250.Â
Yesterday it traded down to
1245 by 10:30 a.m., went sideways, then broke out of a range just after 1 p.m.
and traded up to 1266.47 and closed at 1266.44. All I can say is if they ever
try to stop program trading, lobby against it because it is a trader’s dream if
you know how to use if for what it is — a game. The more program we get, the
more often you will get Slim Jim opportunities as contracted volatility
expands.Â
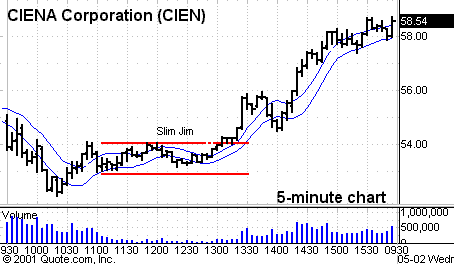
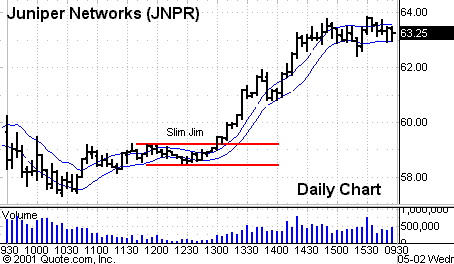
I have included five-minute
charts of JNPR and CIEN below. They are daily breadwinners for daytraders. Both
stocks exploded from multipoint moves from narrow-range Slim Jims. If
you were organized and scrolling, you were ready for the move. You
can’t win the race unless you run it.

Chart 1. Five-minute chart of
(
CIEN |
Quote |
Chart |
News |
PowerRating) with 8-period (high and low) moving averages.Â

Chart 2. Five-minute chart of
(
JNPR |
Quote |
Chart |
News |
PowerRating) with 8-period (high and low) moving averages.Â
The SPYs closed at
127.05, right on the .618 retracement level. The 4% spread of resistance I
mentioned yesterday is from 127 to 132.14. It will get choppy in here with
continued volatility during these first few days of the new month.
Stocks
Today
|
(June
|
||
|
Fair Value
|
Buy
|
Sell
|
|
4.70
|
 6.00 |
 3.45Â
|
In the Semis,
(
NVLS |
Quote |
Chart |
News |
PowerRating),
(
KLAC |
Quote |
Chart |
News |
PowerRating),
(
BRCM |
Quote |
Chart |
News |
PowerRating) and
(
NVDA |
Quote |
Chart |
News |
PowerRating) which has exploded to new highs
yesterday. It had bottomed at 27.5 on 12/21/00, as did most all the Semis
between October through December. I guess the Generals forgot to read all the
negative fundamental news on Semiconductors.
Other Semis are:
(
AMD |
Quote |
Chart |
News |
PowerRating),
(
LRCX |
Quote |
Chart |
News |
PowerRating),
(
IRF |
Quote |
Chart |
News |
PowerRating) and also
(
IDTI |
Quote |
Chart |
News |
PowerRating) and
(
NSM |
Quote |
Chart |
News |
PowerRating) which are both in consolidations just under their
200-day moving average and might want to play catch up. These Semis set up long
on the daily charts if we get any continuation today, but because of their
volatility and extended moves, you should also take any intraday shorts if
presented, especially into this 127-132.65 resistance area on the SPX and that
certainly goes for the Travel Range stocks also.Â
Travel Range stocks that
were extended in price yesterday (but in most cases not in volume) but did set
up on the daily chart include:
(
JNPR |
Quote |
Chart |
News |
PowerRating),
(
CIEN |
Quote |
Chart |
News |
PowerRating),
(
CMVT |
Quote |
Chart |
News |
PowerRating).
Other stocks:
(
RATL |
Quote |
Chart |
News |
PowerRating),
(
DISH |
Quote |
Chart |
News |
PowerRating),
(
HGSI |
Quote |
Chart |
News |
PowerRating),
(
SFA |
Quote |
Chart |
News |
PowerRating),
(
LOW |
Quote |
Chart |
News |
PowerRating),
(
LNT |
Quote |
Chart |
News |
PowerRating) and
(
NOC |
Quote |
Chart |
News |
PowerRating).Â
Have a good trading day.

Chart 3. Five-minute chart of
yesterday’s S&P 500
(
SPX |
Quote |
Chart |
News |
PowerRating) with 8-,
20-, 60-
and 260-period EMAs.

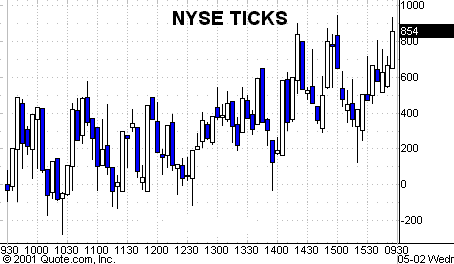
Chart 4. Five-minute
chart of yesterday’s New York Stock Exchange ticks.
