Wednesday’s Stock Watch
The stock market is looking
good as Monday brought all three major averages to closes above their 50-day
moving averages. Leading the charge are technology issues, with
positive signs from the bellwether semiconductors and broker/dealers. Volume and
breadth have been exceptionally strong in recent action, though this is still a
bear market, and short covering must be factored in. This week we are looking
for a 2% advance on one of the indexes as an indication of institutional support
for the lows made last Wednesday.
As we countdown to war with Iraq, smart money
remains sidelined. There is simply too much risk involved in taking a position
before things settle on the war front. We all hope for a quick and decisive
resolution to the conflict.
Stocks on our watch list are in good shape.
Our recent breakouts are making new 52-week highs, and we see no signs of
distribution. The search goes on for stocks meeting our top fundamental and
technical criteria, but few selections are found.
From Tuesday’s action:
Market breadth was positive, with NYSE advancing issues over declining
issues by a ratio of 1.19, and up volume over down volume by a 2.18 ratio. Nasdaq advancing issues over declining issues came
in at 1.24, and up volume beat down volume by a 2.45 ratio.
Dow Jones Industrial Average
(
$INDU.X |
Quote |
Chart |
News |
PowerRating)
closed +0.64%
at 8,194.23. The S&P 500
(
$SPX.X |
Quote |
Chart |
News |
PowerRating) closed
+0.42%
at 866.45.
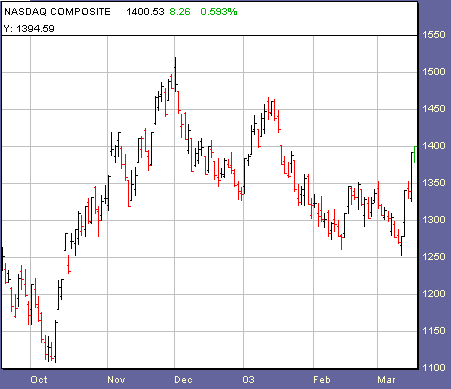
The Nasdaq
(
$COMPQ |
Quote |
Chart |
News |
PowerRating) closed
+0.59%
at 1,400.55.

1,688
1,745
Declining Issues
1,421
1,425
1,002,022,000
1,037,673,000
Declining Volume
497,635,000
534,302,000
Total
Volume
1,519,063,000
1,592,238,000
Highs
12
13
6
2
Strongest Sectors:
Telecoms, Internet, Software, Data Storage, Semiconductors, Cable/Satellite.
Watch List Action:
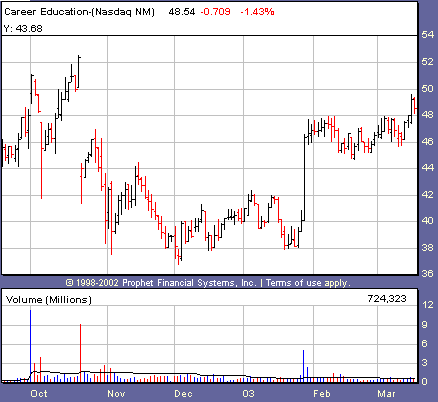
Cruising through its pivot buy point, Career Education Corp
(
CECO |
Quote |
Chart |
News |
PowerRating) failed
to produce the volume needed to trigger an actual buy. For the past four weeks
the stock has made six clear accumulation days and four distribution days. As
mentioned before, this is a late stage base and less likely to succeed. Stocks
that have gone through more than three base breakouts without significant
correction are more prone to failure.

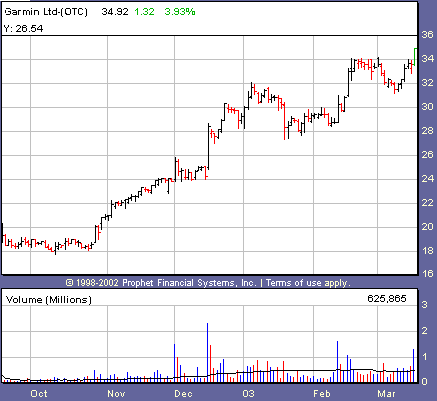
Hitting a new 52-week high, Garmin Ltd.
(
GRMN |
Quote |
Chart |
News |
PowerRating) rallied on almost three
times average volume. This one continues to be a real gem for us.

Recent Breakouts
size=2>We monitor the action of Recent Breakouts as an indicator of
the market health for IT traders. When breakouts are acting well, this is a good
sign for the likelihood of further sustainable breakouts. When breakouts are
failing, IT traders should be even more cautious.
| color=#ffffff size=2>Company Name | color=#ffffff size=2>Symbol | color=#ffffff size=2>12 Month RS | color=#ffffff size=2>Price | color=#ffffff size=2>Price Change | color=#ffffff size=2>Average Volume | Pivot | 52-Week High |
Apollo Group | ( APOL | Quote | Chart | News | PowerRating) | 92 | 48.34 | -0.55 | 1,696,200 | 46.89 | 49.25 |
Coach Inc. | ( COH | Quote | Chart | News | PowerRating) | 94 | 38.50 | -0.30 | 1,154,900 | 28.35 | 39.04 |
Expeditors International of Washington | ( EXPD | Quote | Chart | News | PowerRating) | 89 | 35.61 | +0.09 | 768,400 | 34.54 | 35.81 |
Garmin Ltd. | ( GRMN | Quote | Chart | News | PowerRating) | 95 | 34.92 | +1.32 | 468,100 | 23.46 | 32.07 |
International Game Technology | ( IGT | Quote | Chart | News | PowerRating) | 92 | 82.77 | +0.73 | 1,189,500 | 74.84 | 85.00 |
Stocks Forming a Handle
| color=#ffffff size=2>Company Name | color=#ffffff size=2>Symbol | color=#ffffff size=2>12 Month RS | color=#ffffff size=2>Price | color=#ffffff size=2>Price Change | color=#ffffff size=2>Average Volume | Pivot |
CECO | ( CECO | Quote | Chart | News | PowerRating) | 91 | 48.54 | -0.71 | 770,200 | 48.07 |
UCBH Holdings | ( UCBH | Quote | Chart | News | PowerRating) | 83 | 42.80 | -0.46 | 177,100 | 45.20 |
Stocks Building A Base
color=#ffffff size=2>Company Name | color=#ffffff size=2>Symbol | color=#ffffff size=2>12 Month RS | color=#ffffff size=2>Price | color=#ffffff size=2>Price Change | color=#ffffff size=2>Average Volume | Pivot |
None | Â | Â | Â | Â | Â | Â |
If you are new to the “IT” strategy, be sure to
take a look at our
intermediate-term online trading course.
Intermediate-Term Traders
Report is posted on
Tuesdays and Fridays. For other intermediate-term commentary, be sure to read
Mark Boucher (Fridays),
Tim Truebenbach (Tuesdays and Thursdays), and
Gary Kaltbaum (Mondays and Thursdays).
