274 Point Travel Range
It was a
no-decision day for the major indexes with
narrow-range days for both the Nasdaq 100
(
NDX |
Quote |
Chart |
News |
PowerRating) and S&P 500
(
SPX |
Quote |
Chart |
News |
PowerRating).
The NDX had a high to low range of just 58 points and 1.5 points in the
(
QQQ |
Quote |
Chart |
News |
PowerRating)s.
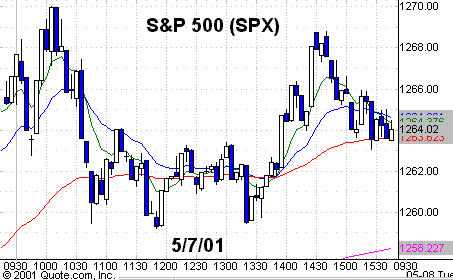
The SPX had a daily range of only 10.7 points as it continues to struggle at the
.618 level of 127 which is the front end of the 127-132 resistance zone and a 14
bar consolidation.Â
The overall volume was only
929 million, a volume ratio of 48 and declines over advances by 134.
Institutional blocks dropped way off to 17,034. You have the Federal Reserve
Super Bowl party next Tuesday and the media will play that game all week
following
(
CSCO |
Quote |
Chart |
News |
PowerRating) today with its earnings and some more economic numbers on
Friday. A news market sets up great fades for traders.Â
Having stated the obvious
for those who watch CNBC or read the newspaper accounts, the appearance is that
the markets stood still yesterday — and they did, if you just read the recap of
the final numbers. However, for traders who are involved all day it was a
different story in the downtrending, choppy market.Â
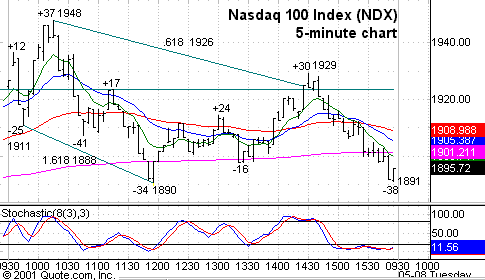
I have included a
five-minute chart of yesterday’s NDX action which you traded with the QQQs.
Although the NDX had a daily range of just 58 points high to low, the real story
was the 274 points of travel range which was over 6 points for the Qs which had
a high of 48.57 and a low of 47.10.
After some early noise, the
NDX traded down to 1911, then rallied 37 points from a Trap Door pattern to
1948, before you got a reversal pattern. From 1948, the NDX traded down to 1890
which was the 1.618 extension of the +37 point leg to 1948. Once the NDX traded
below 1911, you should have been anticipating possible
reversal zones, starting with the following extensions: 1.27, 1.618, 2.168 and
2.24. All of those would be extensions of the +37 point leg.
The exact .618 number was
1888 vs. the 1890 intraday low where you got a reversal-bar entry pattern on a
wide-range bar, top-of-the-range close. From the 1890 low, the NDX rallied to
1929 which was just above the previous close and around the open. The exact .618
retracement to the 1948 high was 1926, so there was the level if you were
looking for a possible reversal-bar entry pattern — which you got.Â
The index traded down to
1891, closing at 1895. There were, of course, intermittent moves — as you will
see on the chart — but I highlighted the three major moves that made your day.
There was a lot more to the game yesterday (if you were in it) that doesn’t show
up in the market summary. I can understand if you didn’t enter from the 1948
pattern reversal, but if you attended my seminar there was no excuse for not
taking the sequence trading moves at the 1.618 extension and the .618
retracement.

Chart 1. Five-minute
chart of yesterday’s
(
NDX |
Quote |
Chart |
News |
PowerRating) with 8,
20, 60
and
260-EMAs.
Stocks
Today
|
(June
|
||
|
Fair Value
|
Buy
|
Sell
|
|
4.00
|
 5.30 |
 2.70 Â
|
Range contraction for the
major indexes does the same for many of the stocks, so scroll for potential
breakouts from tight trading ranges or Slim Jims, and also play the QQQs to take
advantage of the programs and futures games like yesterday.
There are a few daily chart
setups yesterday but there was no volume that went along with it, so stocks you
might focus on are:
(
CAH |
Quote |
Chart |
News |
PowerRating),
(
CHV |
Quote |
Chart |
News |
PowerRating),
(
APC |
Quote |
Chart |
News |
PowerRating),
(
APA |
Quote |
Chart |
News |
PowerRating),
(
LLY |
Quote |
Chart |
News |
PowerRating),
(
SOTR |
Quote |
Chart |
News |
PowerRating),
(
BAC |
Quote |
Chart |
News |
PowerRating),
(
NTRS |
Quote |
Chart |
News |
PowerRating) and also
(
PVN |
Quote |
Chart |
News |
PowerRating).
In the Biotechs:
(
AMGN |
Quote |
Chart |
News |
PowerRating),
(
IDPH |
Quote |
Chart |
News |
PowerRating), and
(
GENZ |
Quote |
Chart |
News |
PowerRating).
In the Travel Range stocks:
(
JNPR |
Quote |
Chart |
News |
PowerRating),
(
SEBL |
Quote |
Chart |
News |
PowerRating),
(
BEAS |
Quote |
Chart |
News |
PowerRating),
(
CIEN |
Quote |
Chart |
News |
PowerRating),
(
PMCS |
Quote |
Chart |
News |
PowerRating) and
(
CHKP |
Quote |
Chart |
News |
PowerRating).
All of these stocks had bottom-of-the-range closes, so be looking for possible
continuation shorts and/or reversal of those lows if it happens.
In the Semis — which have
faded recently on light volume — look at:
(
NVLS |
Quote |
Chart |
News |
PowerRating) and
(
BRCM |
Quote |
Chart |
News |
PowerRating) both of
which have drifted down to the tops of their bases. Also a good two-way action
will probably happen in
(
NVDA |
Quote |
Chart |
News |
PowerRating) which hit a new all-time high yesterday.
Have a good trading day.

Chart 2. Five-minute chart of
yesterday’s S&P 500
(
SPX |
Quote |
Chart |
News |
PowerRating) with 8-,
20-, 60-
and 260-period EMAs.

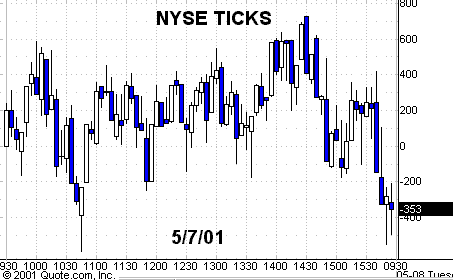
Chart 3. Five-minute
chart of yesterday’s New York Stock Exchange ticks.
