Combine PowerRatings with the VIX for Better Market Timing
Today’s
PowerRatings article will focus on Rule No. 5 of TradingMarkets 10 Rules For
Successful Trading. Rule No. 5 states:
Use The VIX…It Works.
The VIX is the single
best indicator to use to guide you in timing your indices and equity trading.
From the research created by Connors Research Group. TradingMarkets has more
than 16 years of statistical price studies backing this.
First, let’s quickly
define the VIX. The Chicago Board Options Exchange SPX Volatility Index (VIX)
reflects a market estimate of future volatility, based on the weighted average
of the implied volatilities for a wide range of strikes. 1st & 2nd month
expirations are used until 8 days from expiration, then the 2nd and 3rd month
are used.
When markets are
rising the VIX is usually low. When markets are declining the VIX usually rises.
Extreme market sell-offs are associated with extreme VIX readings. Many web
sites and analysts attempt to use static numbers for the VIX. This is wrong
(in the early 2000’s the prevalent wisdom was to buy the market when the VIX
rose above 30 and to sell it when it went below 20. This worked for a short
while until the VIX went under 20 in March 2003 (triggering the so called sell
signal) and over the next two years, the market rose approximately 50% off its
lows while the VIX never saw 30 again during that time!
The proper way to use
the VIX is to look at where it is today relative to its 10-day simple
moving average.
The higher it is above the 10 day moving average, the greater the likelihood the
market is oversold and a rally is near. On the opposite side, the lower it is
below the 10 day moving average, the more the market is overbought and likely to
move sideways-to-down in the near future.
The TradingMarkets 5%
Rule. If you only follow one market sentiment indicator, it should be the
TradingMarkets 5% Rule. The 5% rule states – Do not buy stocks (or the market)
anytime the VIX is 5% below its moving average. Why? Because since 1989, the
S&P 500 cash market has “lost” money on a net basis 5 days following the times
the VIX has been 5% below its 10 day ma. That’s right, in spite of the S&P
500 rising over 300% since 1989, it’s lost money 5 days following the VIX
closing 5% or more below its 10 day ma.
The TradingMarkets 5%
Rule is also extremely powerful on the buy side. Since 1989, whenever the VIX
has been 5% or more above its 10 day ma, the S&P 500 has achieved returns which
are better than 2 1/2 to 1 compared to the average weekly returns of all weeks.
What does this mean
for you? It means the potential edge lies in buying the market and stocks when
the VIX is at least 5% above its 10 day ma, and to lock in gains (and also not
buy) when the VIX is 5% or more below its 10 day ma.
You can find many more
information on this on our website, in our indicators page, and in
“How Markets Really Work” written by Larry Connors and Conor Sen.
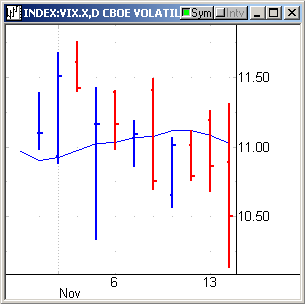
Let’s take a look at the current state of the
VIX in the following chart.

The VIX is currently below its 10-day moving average (blue)
and would have to fall to 10.46 to reach the 5% below level.  We can
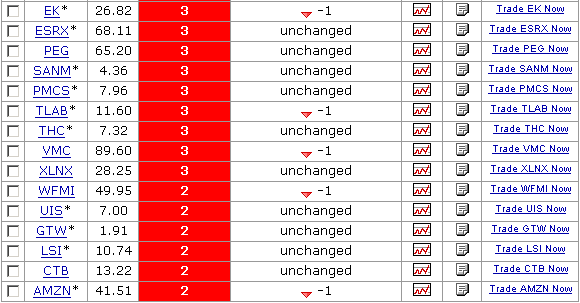
start preparing a watch list of stocks to avoid. More aggressive traders
use this list to find stocks to short. Let’s take a look at S&P 500 PowerRatings and look for stocks rated 3 or lower. The
full S&P 500 PowerRatings list can be found
here.

This trading strategy can also be applied when the VIX is
trading 5% or higher than its 10-day moving average.
Find tomorrow’s winning stocks today!
Click Here!
Attend a free class on how to use
PowerRatings, presented by Steve Primo, our Director of Education.
Darren Wong
Associate Editor
Want a free month of PowerRatings?
Send us your PowerRatings
strategy and receive one free month of this exciting trading tool. If you are
already a monthly or annual PowerRatings
subscriber, you will receive an additional three months if we publish your
strategy.
Reminder: We are in no way recommending the purchase or short sale of these
stocks. This article is intended for education purposes only. Trading should be based on your own understanding of market conditions,
price patterns and risk; our information is designed to contribute to your
understanding.
