PowerRating Chart of the Day
For
aggressive traders and investors, some of the biggest moves on a percentage
basis come from low-priced stocks. If you are willing to assume more risk, you
will find ample opportunities in low-priced stocks with high PowerRatings.
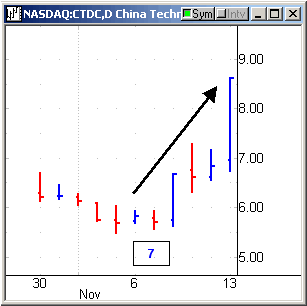
The chart below shows that CTDC had been sliding
for 3 straight sessions 11/01/06 – 11/03/06. This coincided with a
PowerRating of
7 on 11/04/06 suggesting it was likely to outperform the S&P 500 over
the next five days.
From 1995-2005,
stocks with a PowerRating of 8 have outperformed the S&P 500
index on average by an 8.3-to-1 margin, while a PowerRating of 10 doubles that
performance to 16.3.
PowerRatings also help indicate a stock’s
downside as well as timely short-sale entry points; PowerRatings of 1 and 2 have
on average lost money over the next week. A PowerRating of 1 typically
underperformed the S&P 500 by a 5-1 margin. Obviously, you should ideally be
looking to buy high PowerRating stocks and avoid (or short) low PowerRatings
stocks.
Over the next five sessions
CTDC gained 48.28%.

Find tomorrow’s winning stocks today!
Click Here!
Attend a free class on how to use
PowerRatings, presented by Steve Primo, our Director of Education.
Darren Wong
Associate Editor
Want a free month of PowerRatings?
Send us your PowerRatings
strategy and receive one free month of this exciting trading tool. If you are
already a monthly or annual PowerRatings
subscriber, you will receive an additional three months if we publish your
strategy.
Reminder: We are in no way recommending the purchase or short sale of these
stocks. This article is intended for education purposes only. Trading should be based on your own understanding of market conditions,
price patterns and risk; our information is designed to contribute to your
understanding.
