No Market Edge after Rally
Kevin Haggerty is a full-time
professional trader who was head of trading for Fidelity Capital Markets for
seven years. Would you like Kevin to alert you of opportunities in stocks, the
SPYs, QQQQs (and more) for the next day’s trading?
Click here for a free one-week trial to Kevin Haggerty’s Professional
Trading Service or call 888-484-8220 ext. 1.
The seasonal Easter week bias played out with the
SPX (1443.76) and $INDU (12560) both +1.6% on the week, with the QQQQ +2.3% and
$COMPX +2.0%. The commodity sector continued to advance, as the $HUI was
+4.8% on the week, XLE + 3.0% and OIH +2.7%. Drugs also had a good week,
with the PPH +2.8%, as did the SMH +2.6% to 34.24, but it continues to be just a
trading vehicle, as it remains in a trading range since 8/26/06. The SPX
was +1.6% on the week, but it was not really daytrader-friendly, as most of the
move was the Tuesday opening spike that went from the Monday 1424.55 close to
the 1:45 PM 1440.57 intraday high. It ranged out until the 11:55 AM jiggle
on Thursday into the 1443.76 close. The NYSE volume was light on Friday at
1.25 billion shares, with the volume ratio 66, breadth +769 and the 5 RSI 77.
The jobs report on Friday of 180,000 got the
usual “midnight madness” hype by CNBC, but of course they failed to tell you that
129,000 of that number was the phantom net birth/birth adjustment. April’s
number will probably be higher, because it is the month when the Labor
Department adds the largest estimated amount of the “phantom” jobs attributed to
newly formed companies (John Crudele, NY Post). The market was of course
closed on Friday, but as of 7 AM this morning, as I do this, the futures are up
less than a point, so I guess the “players” haven’t decided whether they can
game the report one trading day later. Short-term hype on individual
reports can affect the daily moves, but this market must still contend with
productivity declining, labor costs rising, pricing pressure on corporations,
and reduced capital spending, all of which adds up to lower profit margins.
Maybe that is why about 67% of SPX companies have lowered earnings estimates and
guidance for 2007. When many of these companies report for Q1, the media
will hype “better than expected,” but will fail to say it is on expected
earnings estimates that have already been lowered several times. This
market must also contend with the strong statistical recession record of the
current inverted yield curve, and then you have the housing sector decline,
which is debatably getting worse, not better. The Fed will be under
pressure to inflate its way out of the slower growth, because the current
administration doesn’t have much solid footing pre-2008 elections, other than
the economy’s performance since 2001.
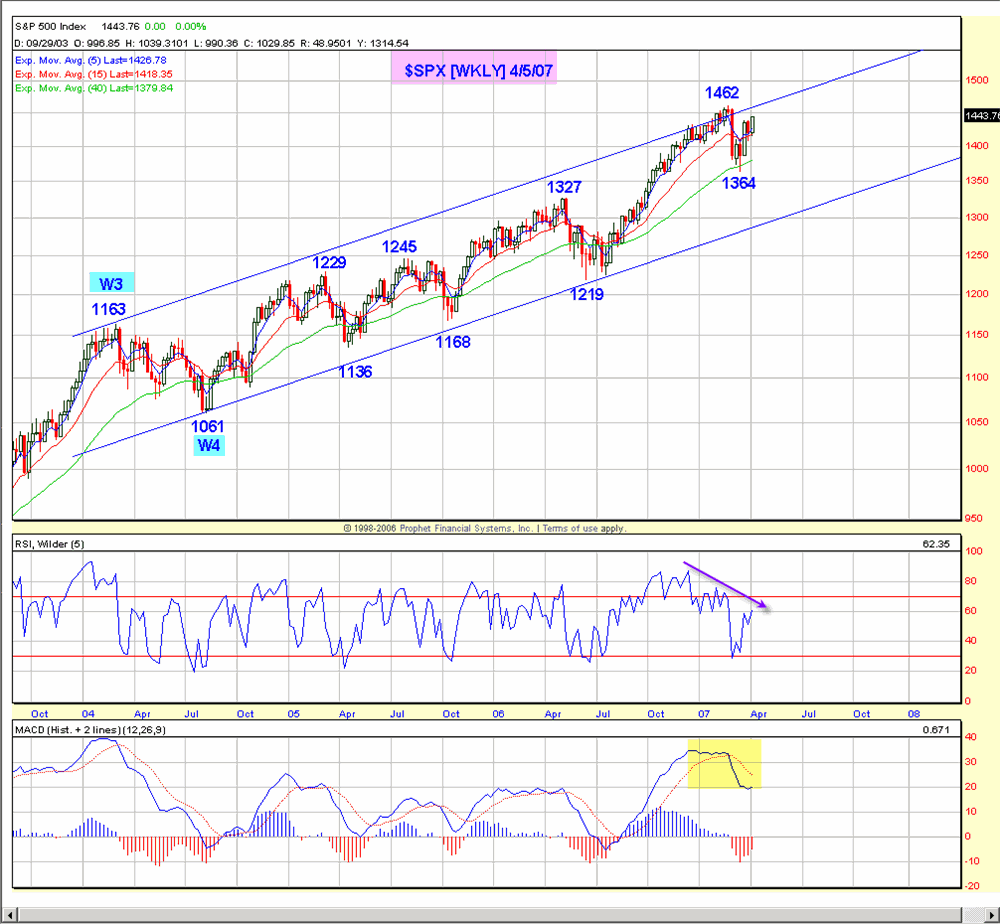
The market has entered the short-term overbought
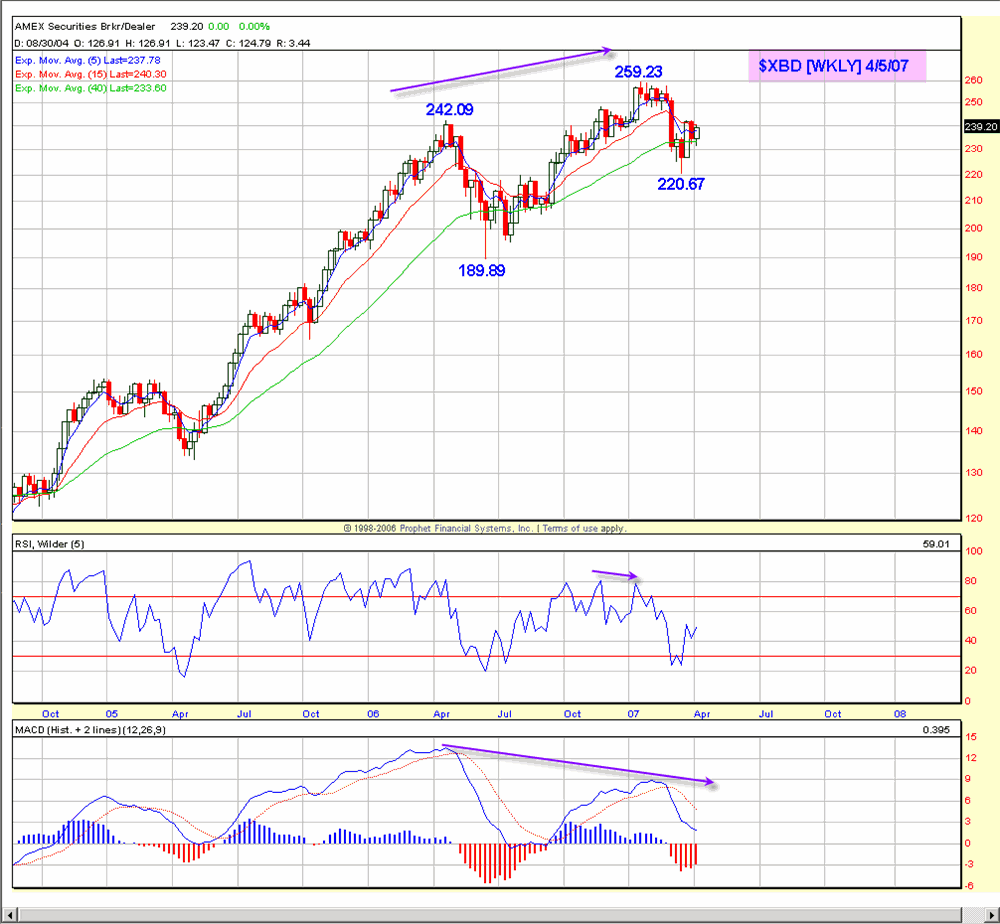
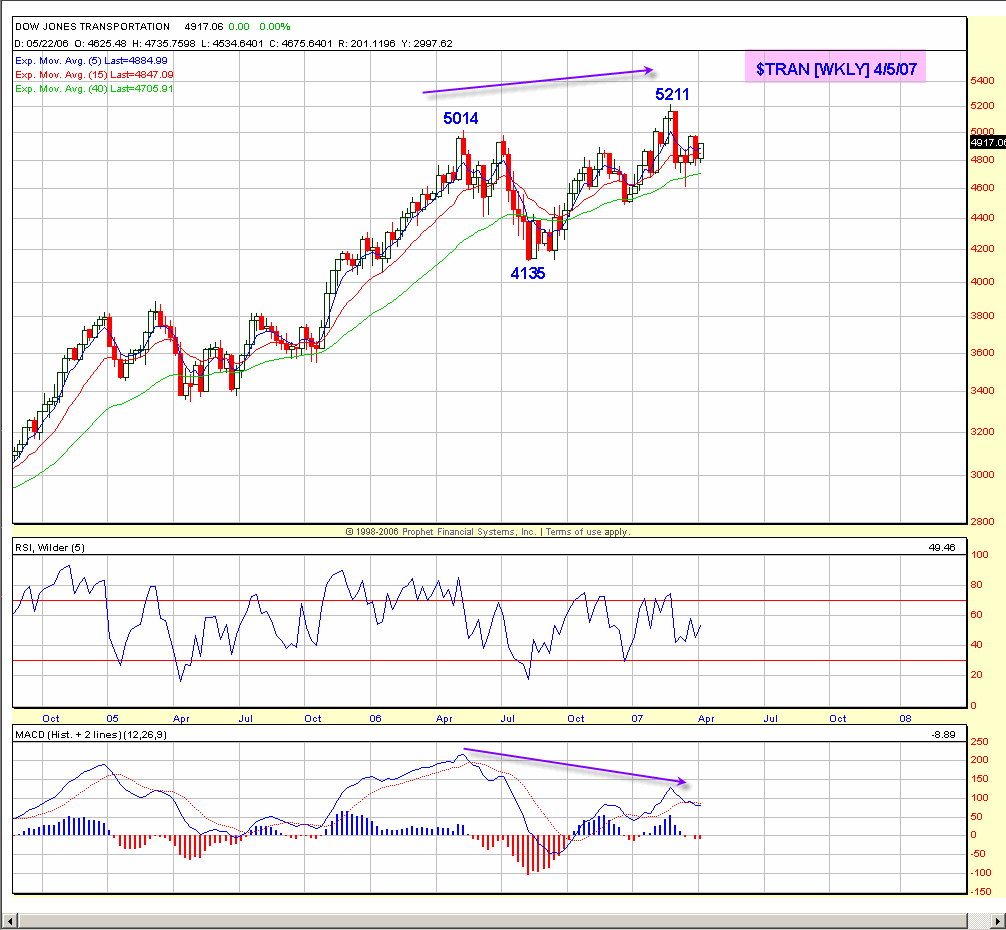
zone, and the longer-term momentum remains negative for all the major indexes
(weekly charts), so the market needs a catalyst right now if “they” expect to
take out the 1461.57 high, which would also set up a longer-term RST sell
pattern. The business cycle is doing what it has always done, and bull and
bear markets will repeat, so what do you think comes next? Seeing that the
current bull cycle is the longest time between market tops for the $INDU in more
than 50 years (thechartstore.com), I would say that the probability is obvious.
Have a good trading
day,
Kevin Haggerty
Check out Kevin’s
strategies and more in the
1st Hour Reversals Module,
Sequence Trading Module,
Trading With The Generals 2004 and the
1-2-3 Trading Module.


