You Can Learn This Powerful Strategy
Kevin Haggerty is a full-time
professional trader who was head of trading for Fidelity Capital Markets for
seven years. Would you like Kevin to alert you of opportunities in stocks, the
SPYs, QQQQs (and more) for the next day’s trading?
Click here for a free one-week trial to Kevin Haggerty’s Professional
Trading Service or call 888-484-8220 ext. 1.
The SPX finished +1 point to 1447.99 on another
narrow-range day of just 6.8 points, which follows 4.8 on Friday and 4.5 on
Monday. That is not trader-friendly travel range. However, both the
SPX and energy sectors were short-term overbought starting the week, and hit key
price zones, so traders using the "Strategies" had a decent day. For
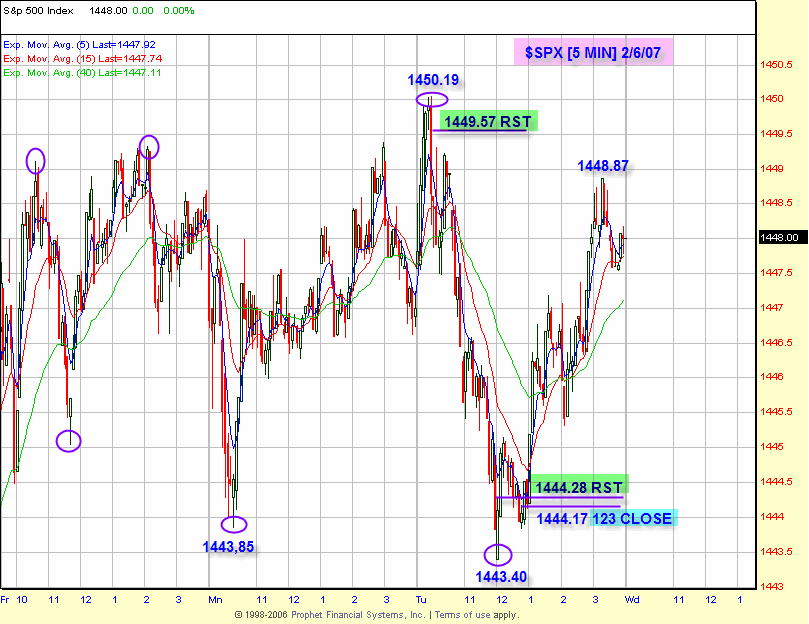
example, the SPX traded up to 1450.19 on the 9:50 AM bar, which is into the
anticipated 1450-1455 key price zone, and this set up the RST short strategy
with entry below 1449.57. It traded down to 1443.40, which set up the RST
buy strategy above 1444.28, or else the 1-2-3 Close entry that followed the
entry above 1444.17. This traded up to 1448.87 before closing at 1448.
Although it was only a 6.8 point daily range day, low to high, the very high
probability RST strategy caught a travel range of 11.64 points, and after
entry/exit levels, about 8.5-9 points were taken out of the "casino." The
key to having the confidence to enter these trades is anticipation of key price
zones, so that you are ready to act if there is an intraday reversal strategy
opportunity from the zones. Many of the energy stocks had the same first
hour reversal strategy and afternoon rally. You can learn the RST strategy
in the Sequence Trading Module, Trading with the Generals 2004, and as a 3-month
member of the trading service.
NYSE volume was on the light side again at 1.47
billion shares. The $INDU was up 4 points (+.04%) to 12666, while the QQQQ
was -.02% 44.05. The sector action was benign, with the TLT +0.6% leading
the upside, while the SMH, after 5 straight up days, was -0.7%. The volume
ratio was still positive at 58 and breadth +893. The 4 MA of the volume
ratio is now 60 and breadth +675. There has been no buying or selling
pressure the past 3 days, and that is indicative of three small daily chart Doji
bars.
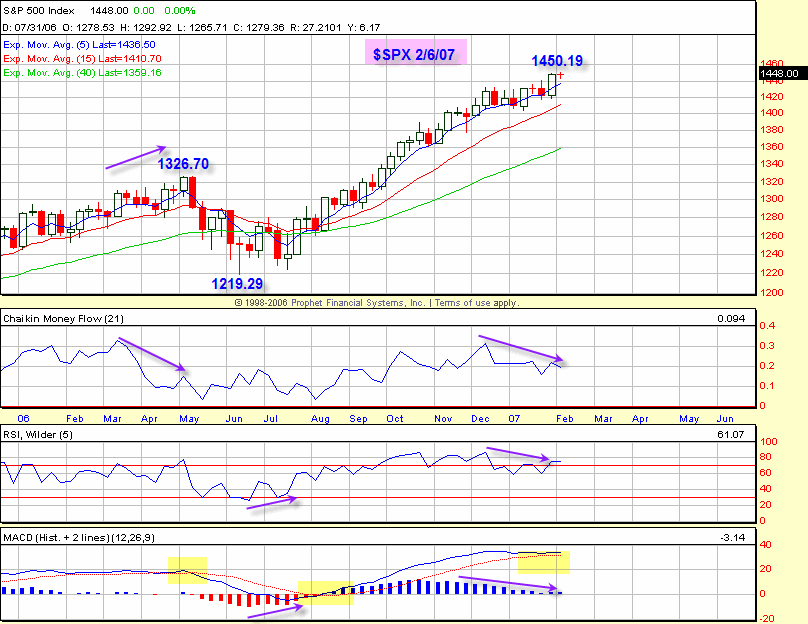
The SPX/$INDU are making new cycle highs with
negative weekly momentum and money flow divergences, so that is obviously a
red-alert. It certainly means there is no edge in longer-term positions
right here. However, with the SPX in a key price zone, daytraders continue
to prosper long and short.
Have a good trading
day,
Kevin Haggerty
Check out Kevin’s
strategies and more in the
1st Hour Reversals Module,
Sequence Trading Module,
Trading With The Generals 2004 and the
1-2-3 Trading Module.


