PowerRatings Heat Maps- Your Quick Guide to Market Health
As the media has been endlessly reporting on new record highs being made in
the major indices, we need a concrete tool to keep us from getting caught up in
the hype.
We need something to help us methodically and objectively assess the markets.
Also, this tool must be quick and easy to use. Fortunately, our new
PowerRatings
Heat Maps
have just been released and we now have the power to instantly see where the
market stands. Let’s take a look at the Heat Map for the close on Friday
January 12, 2007.
For a primer on how to read our Heat Maps, click
here.
From the Heat Map below, we can see an abundance of red
squares, which represent stocks that have PowerRatings of 1, 2, or 3. This
means that the overall market is showing anticipated stalling or weakness over
the next 5-8 trading sessions. This doesn’t mean, however, that the markets
cannot continue to rally, but that one should be cautious when the markets have
made a nice upward move. The map also suggests that it may be time to take
profits and for the aggressive trader to look for short opportunities.

For traders not familiar with our research on shorting below
the 200-day moving average, click
here.
Now let’s take a look at some of the weakest individual stocks
from the Drug and Metals and Mining sectors:
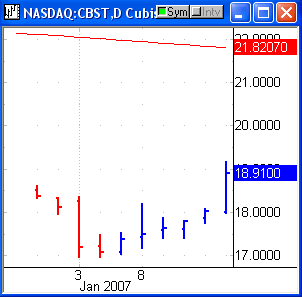
Cubist Pharmaceutical
(
CBST |
Quote |
Chart |
News |
PowerRating)

CBST’s PowerRating is 2. CBST has been trading below its
200-day moving average (red line), which confirms its strong downtrend.Â
Recently, CBST has been rising steadily over the last 6 sessions. Look for
CBST to potentially move lower over the next week.
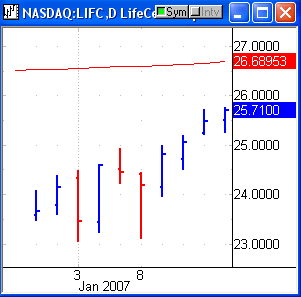
LifeCell
(
LIFC |
Quote |
Chart |
News |
PowerRating)

Â
LIFC’s PowerRating is 3. LIFC has also been downtrending
recently, but is currently pulling back up towards its 200-day moving average.Â
Look for a possible move to the downside over the next 5-8 sessions.
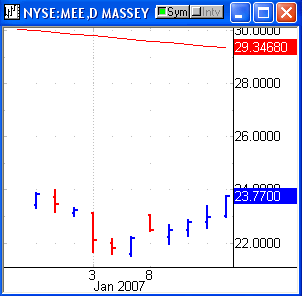
Massey Energy
(
MEE |
Quote |
Chart |
News |
PowerRating)

MEE’s PowerRating is 2. MEE has been rising over the last 4
sessions even as the energy sector has been selling off. Look for MEE to
potentially resume its downtrend in the short term.
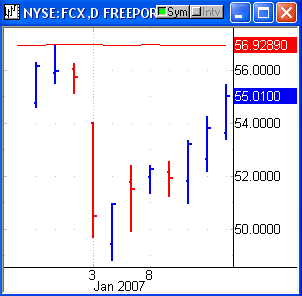
Freeport McMoran
(
FCX |
Quote |
Chart |
News |
PowerRating)

FCX’s PowerRating is 3. This is another weak stock that has
been trading below its 200-day moving average. As you can see from the
chart above, the last time FCX ran up to its 200-day moving average on
12/28/2006 it was rejected and pushed lower. Keep the above stocks on your
watch lists and monitor them for potential entries.
Click here to start a free trial to PowerRatings and find stocks which have
historically outperformed the market.
Attend a free class on how to use
PowerRatings, presented by Steve Primo, our Director of Education.
Darren Wong
Associate Editor
Would you like to receive PowerRatings for full month for free? Send us your
PowerRatings strategy and if we accept it for publication, you will receive one
free month of unlimited access to PowerRatings. If you are already a monthly or
annual PowerRatings subscriber, you will receive an additional three months if
we publish your strategy.
Reminder: We are in no way recommending the purchase or short sale of these
stocks. This article is intended for education purposes only. Trading should be based on your own understanding of market conditions,
price patterns and risk; our information is designed to contribute to your
understanding.
