PowerRatings Heat Maps
PowerRatings Gold subscribers can access a new
powerful tool called PowerRatings Heat Maps. Click here for a free trial.
PowerRatings Heat Maps allow you to quickly and
easily identify the highest and lowest rated stocks, and group of stocks by
market sector. Each stock is represented by a color-coded box that corresponds
with the stock’s PowerRating.
This visual representation of the market shows
you, at a glance, which stocks and sectors are likely to outperform the market
over the next five days. It also shows which stocks are sectors should be
avoided as they are likely to under perform over the next five days.
PowerRatings Heat Maps help you determine how to allocate your portfolio
objectively, based on quantitative research, that allows you to focus on the
best opportunities as they shift from one sector to another.
PowerRatings Heat Map
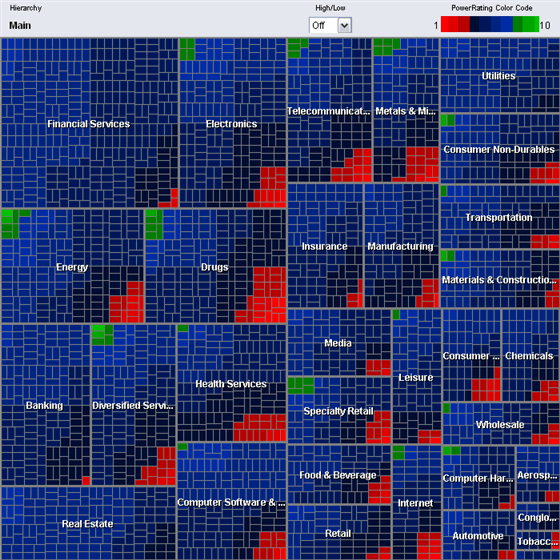
PowerRatings Heat Maps are broken down into 31
different market sectors (figure 1), with each of the stocks in that sector
represented. Moving your mouse cursor over each individual box will reveal the
stock symbol and its accompanying PowerRating.

Figure 1
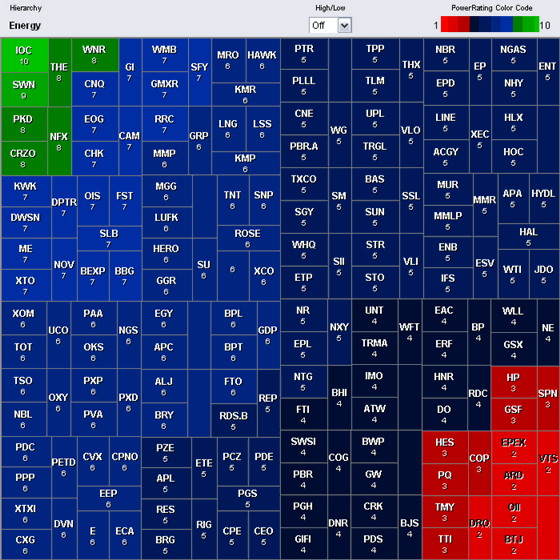
Clicking on a box gives you the option of
zooming into that sector for a closer look (figure 2), getting a quote for that
individual stock or adding that stock to your watch-list.
Close-up of the Energy Sector

Figure 2
There are a number of additional features that can be accessed via the drop-down
menus:
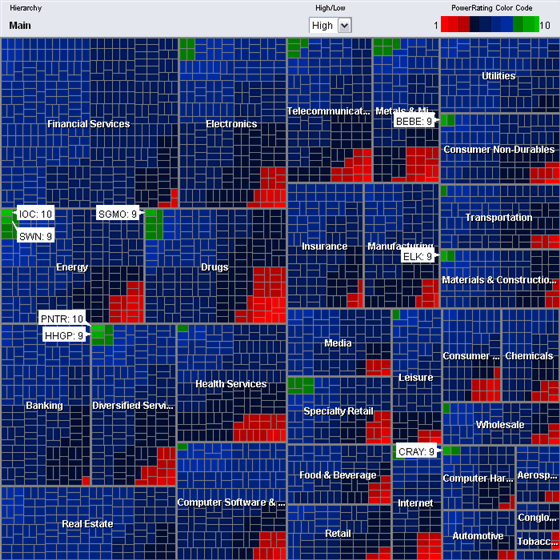
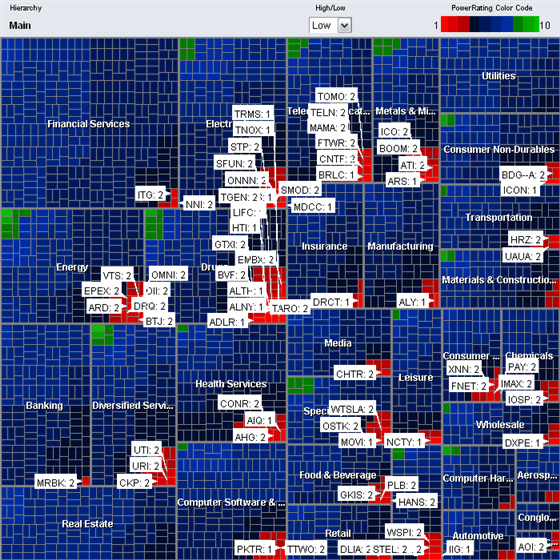
- The High/Low tool identifies the highest
(figure 3) and lowest rated stocks (figure 4).
Top PowerRatings Stocks
Instantly access all the stocks with PowerRatings
of 9 and 10. Stocks with high PowerRatings have historically shown the greatest
out-performance versus the S&P 500.

Figure 3
Bottom PowerRatings Stocks
Instantly access all the stocks with PowerRatings
of 1 and 2 at the click of a button. Stocks with low PowerRatings have
historically shown the greatest under-performance versus the S&P 500. Most
investors should avoid these stocks, while aggressive traders should consider
short selling strategies to take advantage of stocks with low PowerRatings.

Figure 4
PowerRatings as a Market Indicator
PowerRatings Heat Maps also present a snapshot of
the overall market’s health. Figure 3 shows very few stocks with high
PowerRatings, while figure 4 shows a much greater number of stocks with low
PowerRatings. This suggests there are few good buy candidates and many stocks to
avoid or consider selling short. Overall, there are many more red boxes
(bearish) than green (bullish). This suggests the market as a whole is most
likely over-extended and traders should exercise caution. Conversely, when the
PowerRatings Heat Map shows a greater number of green boxes traders should
consider a more aggressive approach.
As you can see from the images above, PowerRatings Heat Maps
present a powerful, yet easy to use, way of analyzing the stock market from
either a top-down or bottom-up approach. They allow you to visually inspect the
entire market of PowerRatings stocks in order to find the best trading
opportunities.
Gaining an edge in the markets used to take hours of daily research.
PowerRatings Heat Maps are about to change that.
Click here for your free trial.
PowerRatings Disclaimer
The Connors Group, Inc. (“Company”) is not an
investment advisory service, nor a registered investment advisor or
broker-dealer and does not purport to tell or suggest which securities customers
should buy or sell for themselves. The analysts and employees or affiliates of
Company may hold positions in the stocks or industries discussed here. You
understand and acknowledge that there is a very high degree of risk involved in
trading securities. The Company, the authors, the publisher, and all affiliates
of Company assume no responsibility or liability for your trading and investment
results. Factual statements on the Company’s website, or in its publications,
are made as of the date stated and are subject to change without notice.
It should not be assumed that the methods,
techniques, or indicators presented in these products will be profitable or that
they will not result in losses. Past results of any individual trader or trading
system published by Company are not indicative of future returns by that trader
or system, and are not indicative of future returns which be realized by you. In
addition, the indicators, strategies, columns, articles and all other features
of Company’s products (collectively, the “Information”) are provided for
informational and educational purposes only and should not be construed as
investment advice. Examples presented on Company’s website are for educational
purposes only. Such set-ups are not solicitations of any order to buy or sell.
Accordingly, you should not rely solely on the Information in making any
investment. Rather, you should use the Information only as a starting point for
doing additional independent research in order to allow you to form your own
opinion regarding investments. You should always check with your licensed
financial advisor and tax advisor to determine the suitability of any
investment.
HYPOTHETICAL OR SIMULATED PERFORMANCE RESULTS
HAVE CERTAIN INHERENT LIMITATIONS. UNLIKE AN ACTUAL PERFORMANCE RECORD,
SIMULATED RESULTS DO NOT REPRESENT ACTUAL TRADING AND MAY NOT BE IMPACTED BY
BROKERAGE AND OTHER SLIPPAGE FEES. ALSO, SINCE THE TRADES HAVE NOT ACTUALLY BEEN
EXECUTED, THE RESULTS MAY HAVE UNDER- OR OVER-COMPENSATED FOR THE IMPACT, IF
ANY, OF CERTAIN MARKET FACTORS, SUCH AS LACK OF LIQUIDITY. SIMULATED TRADING
PROGRAMS IN GENERAL ARE ALSO SUBJECT TO THE FACT THAT THEY ARE DESIGNED WITH THE
BENEFIT OF HINDSIGHT. NO REPRESENTATION IS BEING MADE THAT ANY ACCOUNT WILL OR
IS LIKELY TO ACHIEVE PROFITS OR LOSSES SIMILAR TO THOSE SHOWN.
The Connors Group, Inc.
15260 Ventura Blvd., Ste. 2200
Sherman Oaks, CA 91403
Copyright © The Connors Group, Inc., 2006.
