Primary Focus Energy Stocks Hit New Highs
Kevin Haggerty is a full-time
professional trader who was head of trading for Fidelity Capital Markets for
seven years. Would you like Kevin to alert you of opportunities in stocks, the
SPYs, QQQQs (and more) for the next day’s trading?
Click here for a free one-week trial to Kevin Haggerty’s Professional
Trading Service or call 888-484-8220 ext. 1.
There was continued negative divergence last
week, as the SPX/$INDU bubble was pushed higher by a smaller group of blue chip
stocks, as the SPX was +1.2% and $INDU +1.4%. However, finishing negative on the
week was the IWM -0.7%, QQQQ -0.2%, $COMPX -0.1%, $XBD -0.5%, SMH -0.2% and IBB
-0.6%. It was all about energy last week, with both the OIH and XLE +1.6% on
Friday, and +4.6% and +4.1% on the week. The only sector that was in line with
the SPX +1.2% and $INDU +1.4% was the PPH +1.4%. Also, the TLT finished the week
-1.6% and is down 6 straight days. It was a better trading day than normal for
an expiration Friday, despite the SPX remaining trend up after the initial gap
open, with the SPX hitting 1518.30 on the first bar, versus the previous 1512.75
close. It traded to 1520.61 on the 10:25 AM bar, and the day was essentially
over as it went sideways into the 1522.75 close, picking up in the last 30
minutes from 1520.09. The SPX gapped higher 4 of 5 days last week, with Friday
being the only one without a good contra move. NYSE volume expanded to 1.64
billion shares, with the volume ratio 75 and breadth +811, while the 4 MA of
breadth is just +34, with a new cycle SPX high at 1522.75. Intermediate breadth
indicators also have a negative divergence, helped in part by the rising rates
the last 2 weeks, with the TLT -1.7%.
There were many daytrading opportunities in the
energy stocks that did not gap on the opening, but then went trend up. There
were extended reversals in semiconductors, like KLAC, which had declined to the
-2.0 Volatility Band zone, and rallied +1.0% from entry, in addition to an RST
reversal in the SMH, which ran +0.9% from entry. The better index trade was the
IWM, which set up at the 50-day ema (81). The initial entry was a re-cross of
the 50-day ema, which ran +1.3%, and then the first consolidation breakout to
new intraday high entry, which was the second alternative, advanced +1.0% from
entry. This IWM opportunity was anticipated by trading service members. The OIH,
as anticipated, made a new cycle high of 170.14 Friday, closing at 169.98,
versus the previous 169.75 high on 5/11/06. Many component stocks were also
setup in daily chart contracted volatility patterns at their highs, and
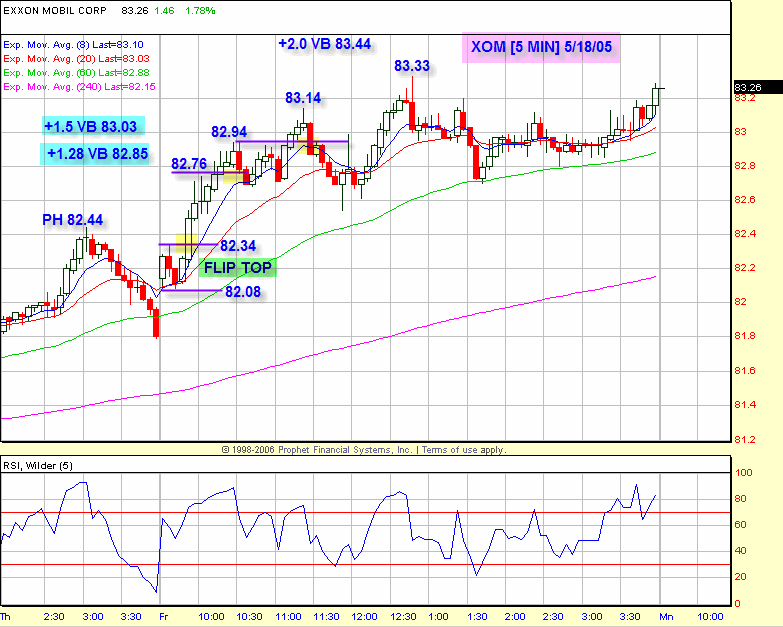
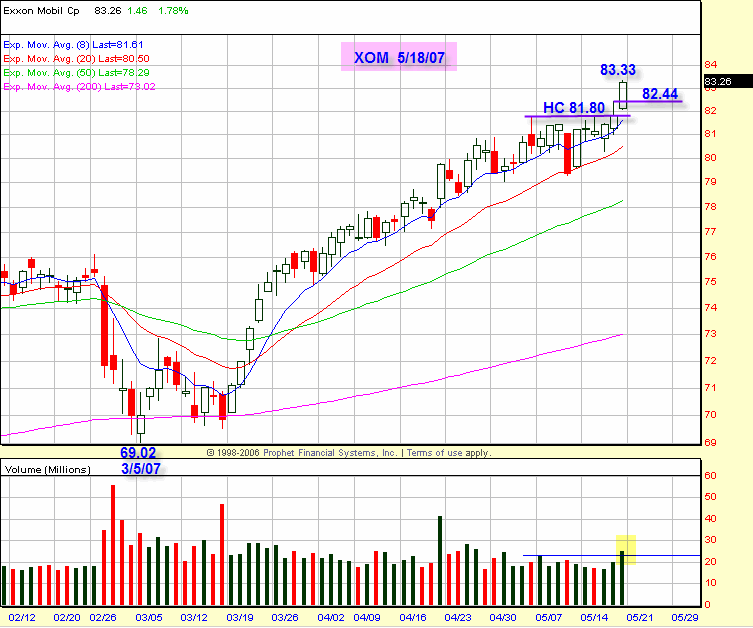
daytraders capitalized on the strong move on Friday. The XOM charts are an
actual example of a trading service trade Friday, where XOM opened in line,
formed a basic Flip Top just below the previous day’s high. Entry was above
82.34, which then became a trade-through entry above the 82.44 daily chart
Thursday high. The trade was exited in 2 parts, at 82.36 and 82.94, with
symmetry with the Volatility Bands.
The last 3 years has a strong up-bias from
Wednesday into the Memorial Day weekend, and with the SPX having closed at
1522.75 on Friday, it is a good time for the "gang" to take out the 1533 3/24/00
intraday high, in addition to the 3/23/00 high close of 1527.75. Prudent
long-term index proxy investors have taken their cash off the table and remained
in the market by buying 6-month index calls, in case the PPT can continue to
manipulate this bubble into the 2008 Presidential election. They have a defined
risk, and get all the index upside above the premium paid for the call, and if
they get called away, they can roll the strike price up. Others who can’t do
that bought 6-month puts, while some just reduced their overall equity
allocation. The risk/reward is obviously not in the market’s favor.
Have a good trading day,
Kevin Haggerty
Check out Kevin’s
strategies and more in the
1st Hour Reversals Module,
Sequence Trading Module,
Trading With The Generals 2004 and the
1-2-3 Trading Module.


