Traders Focus Into Month End
Kevin Haggerty is a full-time
professional trader who was head of trading for Fidelity Capital Markets for
seven years. Would you like Kevin to alert you of opportunities in stocks, the
SPYs, QQQQs (and more) for the next day’s trading?
Click here for a free one-week trial to Kevin Haggerty’s Professional
Trading Service or call 888-484-8220 ext. 1.
The SPX closed yesterday at 1524.17 (-.06%) after
an intraday high of 1529.24, and can possible take out the 1553 3/24/00 bull
cycle top by this weekend. The SPX futures are +5.5 points at 7:05 AM Eastern
time, so if that holds, it will only take a few buy programs to take out the key
level today, at least on an intraday basis. Markets usually don’t reverse until
significant highs or lows are taken out. The daily range for the SPX this week
so far is only 7.8 points, between 1529.87-1522.05, and this narrow range will
most likely be resolved to the upside into the weekend, with the Memorial Day up
bias. The last 3 years have all traded higher into this holiday weekend.
Energy remains the dominant sector for daytraders,
and the OIH took out the previous 169.75 high last Friday, and made another new
high of 173.14 Monday before pulling back yesterday to close at 168.45. The key
angle symmetry from the 40.22 bear market low (9/27/01) is 171.40, 174.69 and
178. The OIH is a +4.3 bagger off that 40.22 low (173.14/40.22), while the SPX
is a +2.1 bagger off the 768.63 low. The energy sector is obviously very
extended, and there is no traders edge unless there is some more pullback, but
this might be delayed because next week is the last 3 days of the month, and the
generals might decide to decorate their largest energy portfolio holdings.
NYSE volume was 1.51 billion shares yesterday,
and the internals were neutral with the volume ratio 52 and breadth +241. The
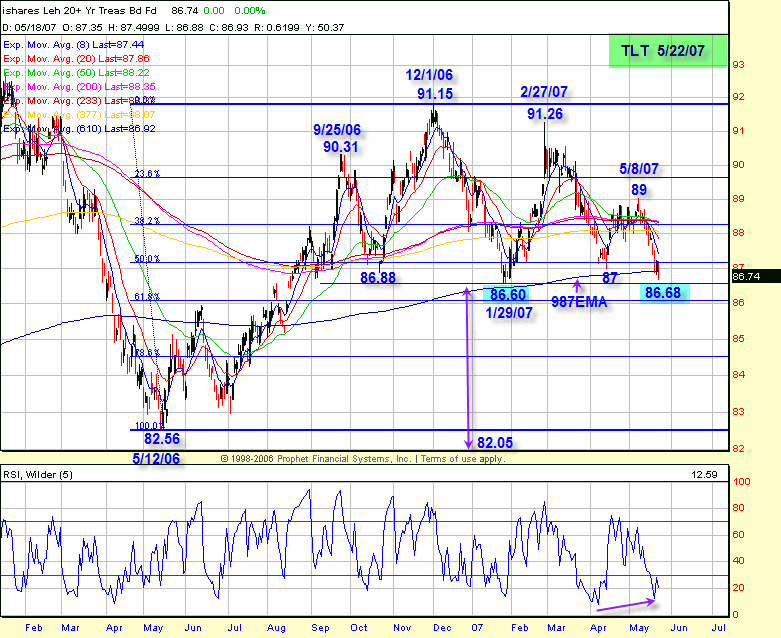
TLT was -0.6% yesterday, and is at the neckline of a big head and shoulder
pattern that started in 9/06. It closed at 86.74, with the neckline low at
86.60. As you can see on the chart, both of these lows have symmetry with the
610 ema (Fibonacci). The high of this pattern is 91.15 on 12/1/06. The last
significant low is 82.56, made on 5/12/06. Rising rates may help the $US dollar,
but not the housing market, which is much weaker in most parts of the country
than the bogus government statistics indicate, and most of all the consumer. An
inflationary recession is alive and well, but so is the equity market teflon
bubble that continues to defy reality and time, so much so that the PPT still
refuses to release the minutes of their frequent Open Market Committee meetings
despite being requested by some in Congress, in addition to others under the
Freedom of Information Act. That in itself indicates they have become much more
active in the markets, other than the 1987 crash and the 9/11/01 disaster when
the NYSE was also closed 4 days. The $US dollar looks to have anticipated the
rise in rates, as it rallied from 81.25 (5/1/07) to a 82.41 close yesterday,
while the TLT declined from 89 on 5/8/07 to 86.74 (see chart). This is a key
level, as the TLT is short-term oversold, at major support and also retracement
symmetry at 85.74-86.
Daytraders should continue to focus on ATL (Above
The Line) stocks (20>50>200), especially those that have pulled back to the
rising 20 or 50-day ema, in addition to contracted volatility patterns at or
near the highs.
Have a good trading day,
Kevin Haggerty
Check out Kevin’s
strategies and more in the
1st Hour Reversals Module,
Sequence Trading Module,
Trading With The Generals 2004 and the
1-2-3 Trading Module.

