Symmetry of Price, Time and Volatility
Kevin Haggerty is a
full-time professional trader who was head of trading for Fidelity Capital
Markets for seven years. Would you like Kevin to alert you of opportunities in
stocks, the SPYs, QQQQs (and more) for the next day’s trading?
Click here for a free one-week trial to Kevin Haggerty’s Professional
Trading Service or call 888-484-8220 ext. 1.
In the previous commentary (7/9/07), I said there was no edge starting this
week, as the QQQQ had advanced 5 days as of last Friday, and Monday made it 6,
while the SPX was up 5 straight days as of Monday. The SPX was also approaching
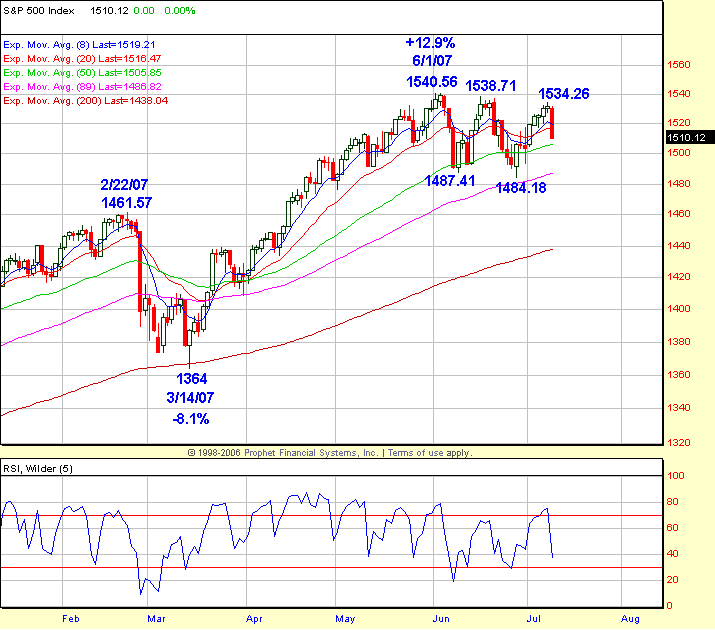
the top of its range, and the 1535-1540 key price zone, with the cycle high at
1540.56. Traders have been able to capitalize on the 8-week trading range. The
negatives mentioned in that commentary surfaced again yesterday, like the
subprime problem, and now the pile-on credit ratings reductions, which will
obviously affect more hedge funds, the weakening housing market, and most
important is the $US Dollar weakness. The $US Dollar closed at 80.85 yesterday,
taking out the 81.25 double bottom, with the 10-year 80.39 low next in line,
just a shade of the 1987 analogy, which I have previously discussed in these
commentaries.
The major indexes traded down in the 1st hour, and this set up the long Trap
Door strategies in the index proxies/futures. The energy Trap Door opportunities
like XLE and SLB, to name a few, had additional symmetry with their -1.0
Volatility Band zones, so the probability of a successful trade was enhanced.
The XLE ran from the strategy entry at 71.55 to 72.67 before the exit below a
72.42 ledge. SLB had the same setup, and ran from 87.22 to a range reversal exit
below 88.22. The exit timing was good because the market traded sideways until
the 1:45 PM knife down following Bernanke’s inflation statement, and subsequent
drop in the $US Dollar to its weakest relationship to the euro since its
inception in 1999 at 1.3740. The SPX traded down from 1521.49 on the 1:45 PM bar
to an intraday low of 1510 and closed at 1510.12, -1.4% on the day. The $INDU
was -1.1% to 13502, QQQQ -0.8% and COMPX -1.2%.
NYSE volume accelerated on the afternoon decline, and finished at 1.64
billion shares, with the internals very negative, with a volume ratio of just 14
and breadth -1761. The down volume was 1.39 billion shares, versus the 1.33
billion share total volume on Monday, when the SPX was +0.9% to a 1534.26 high.
The time symmetry was very interesting in conjunction with the SPX -1.4% day,
and $US Dollar decline below the 81.25 double bottom. July 10 is trading day 270
(Gann) from the 6/14/06 SPX 1219.29 low, where this spike all started very
conveniently in front of the mid-term election, which obviously didn’t help
because the socialists gained control of Congress. There was also the
anniversary of the 7/18/32 all-time low, which fell this past Sunday, so that
carries over and is right on the money. Things seem to keep happening around
these key price and time zones. The SPX failure at 1534.26 on Monday, followed
by yesterday’s decline, which reversed the previous 5 closes to 1510, makes this
8-week range a continuing series of lower highs and lows, as you can see on the
chart. However, it still remains a primary ATL (Above The Line) trend, with the
20 ema> 50 ema> 200 ema, so the trading range tactics remain in play, but for
investors, the risk/reward unhedged in this market is much too negative.
Have a good trading day,
Kevin Haggerty
Check out Kevin’s strategies and more in the
1st Hour Reversals Module,
Sequence Trading Module,
Trading With The Generals 2004 and the
1-2-3 Trading Module.

