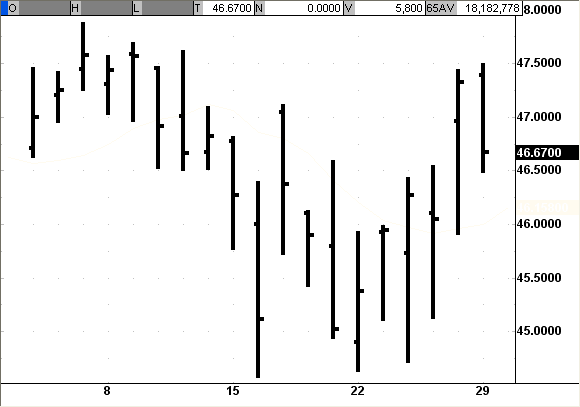
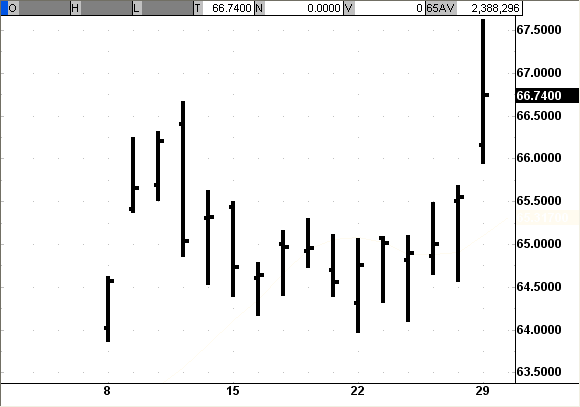
JP Morgan, Cardinal Health Indicator Highlights
TradingMarkets Indicators are a great way to get a solid grasp on the overall
market bias. Even by checking just one list, you gain an edge by identifying the
number of stocks in oversold or overbought territory.
Click here to go deeper into our research of short-term price movement.
Today, one list that stands out among many is the 5+ Consecutive Higher Highs
list. These are stocks that have made a higher high for five or more consecutive
days and are trading below their 200-day moving average. Our research
shows that stocks trading below their 200-day moving average that make higher
highs for five or more days have shown negative returns, on average, 1-day,
2-days and 1-week later. Historically, these stocks have provided
traders with a significant edge.
Click here to view the list, which is open to the public for the rest of the
week.
The first thing you should notice is how many stocks are on this list. There
aren’t just 10 or 20 stocks on the list; there are over 80 stocks in our
database that made new highs for 5 or more consecutive days. Automatically,
you should realize that across the market, there are a relatively large number
of stocks that are short-term overbought. These stocks have historically led to
losses over the next 5 days. Our research confirms that overbought conditions
normally lead to a drop in price, as the stock reestablishes “mean conditions.”
All of the stocks on this list are short-term overbought. Watch for
these stocks to fall in price over the next 5 days, because that is where the
historical edge lies. Also, if you see a stock on this list, go through that
sector and look for other overbought opportunities. Often, when one stock in a
group is overbought, there are more in the same group.
JP Morgan
(
JPM |
Quote |
Chart |
News |
PowerRating) has a PowerRating (for Traders) of 4.

Cardinal Health
(
CAH |
Quote |
Chart |
News |
PowerRating) has a PowerRating (for Traders) of 4.

