Extended Volatility Trading Strategies
Kevin Haggerty is a full-time
professional trader who was head of trading for Fidelity Capital Markets for
seven years. Would you like Kevin to alert you of opportunities in stocks, the
SPYs, QQQQs (and more) for the next day’s trading?
Click here for a free one-week trial to Kevin Haggerty’s Professional
Trading Service or call 888-484-8220 ext. 1.
Three of the 4 major indexes finished red
yesterday, with the SPX -0.1%, and both the QQQQ and $COMPX -0.8%, while the
"funny money" price index, the $INDU was +0.3%, led by GM (+4.4%) AA (+2.5%) and
VZ (+2.3%). NYSE volume expanded to 1.64 billion shares, with the volume ratio
43 and breadth weak at -788. The semis and brokers led the downside with the SMH
and $XBD each -1.3%. The market action was trader-friendly, as the SPX opened
higher to 1507.54, then had a 3-bar pullback to 1502.93 at the 480 ema on the
5-minute chart. This is the same as the 20 ema on a 120-minute chart, which I
use as the longer-term intraday trend chart for daytrading. Look for setups on
the 5-minute chart when prices are between the 480 (20) and 816 (34) emas. The
SPX rallied to the +1.0 Volatility Band 1513.04 zone, with the 1513.61 high on
the 10:15 AM bar, but failed to take out the previous 1513.80 SPX cycle high.
This was the 1st RST sell opportunity, but it only declined to 1507.33 before
reversing to 1514.83 on the 12:40 PM bar, which set up the primary RST, because
the 1513.80 high was taken out. The entry at 1513 declined to 1501.22 at the 816
ema, where the trade was exited. It kicked up to 1504.84 before closing on the
lows at 1501.19. Sorry for the minute detail, but many traders who have learned
the RST from the
Sequence Trading and
Trading With The Generals seminar modules can use the update from time to
time to check their work.
One of the core tenets of my trading methodology
is to concentrate on contracted and extended volatility. The RST and 1-2-3 are
the primary extended volatility strategies, used in conjunction with the
Volatility Bands, Standard Deviation levels and Price and Time symmetry. The
last key price zone before the 2000 bull market 1552.87 top starts at 1514, and
that was also in play yesterday, with the Volatility Band and RST setup. The
energy sector opened in line yesterday, and this set up many 5-bar contracted
volatility patterns, which I call Flip Tops. The OIH broke out above 162.50 and
traded to 164.80 before reversing with the SPX in the afternoon to close at
162.58. Many component OIH/XLE stocks like SLB, SII, CAM, RIG and GRP to name a
few, had the same contracted volatility setups, so traders had no problem
catching the move.
It is option expiration week, and trading gets
erratic. On Monday the SPX gapped to 1510.90 on a 9:35 AM bar, then went
sideways until the 1:35 PM knife down to 1498.34 before closing at 1503.19.
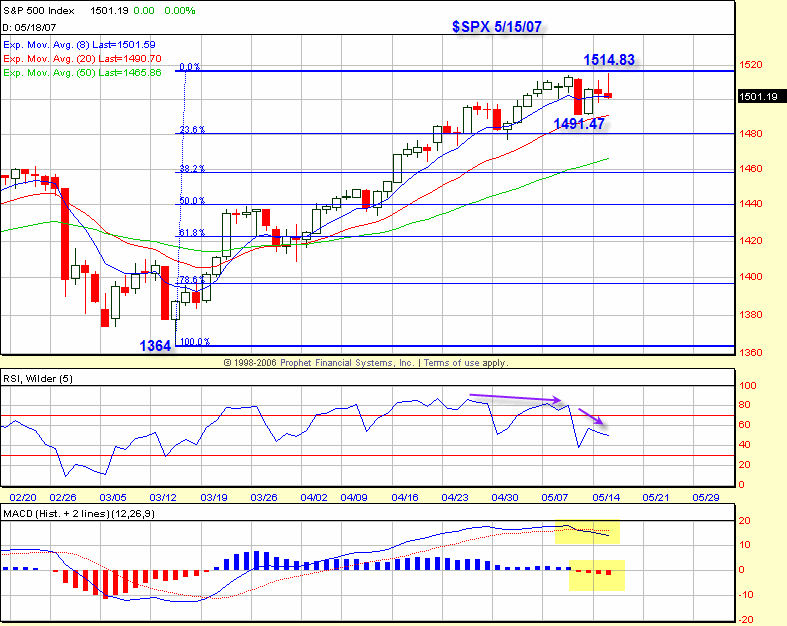
Yesterday, the initial move traded to a 1514.83 high, and then had the afternoon
knife down to a 1501.19 close. Sounds like there’s some option expiration
trading going on. The artificial volatility following economic reports continues
to provide many opportunities for daytraders, as this creates the reactionary
trading strategies at extended levels, like RST and 1-2-3. This week also has
several Fibonacci/Gann time dates, so volatility is no surprise. The SPX is 43
trading days off the 3/14/07 1364 key price zone low, without even a .236
retracement, and the momentum indicators have a negative trend divergence,
despite the rising prices. Unless "they" can "buy program" the SPX to 1533 first
or not, the index will soon reverse.
Have a good trading day,
Kevin Haggerty
Check out Kevin’s
strategies and more in the
1st Hour Reversals Module,
Sequence Trading Module,
Trading With The Generals 2004 and the
1-2-3 Trading Module.

