Some Trends, They Never End
When I first started trading, I used what I now consider fairly simplistic, perhaps even barbaric methods. I had a friend who would take my trades via phone and I would drive him nuts calling sometimes 20 or 30 times a day with various trades. Obviously this was very costly and rather foolish. I felt a false sense of loyalty. He was my bud, my pizano, my cemosabe. As it turned out, I was his sucker. Now, we’re no longer friends.
Calling in trades, spending $25 or so a trade doesn’t really work for any trader, let alone a professional trader. And, it will lead to the inevitable “bad trade” whereby there was some miscommunication that seems to always lead to a bad loss that should have and could have been avoided.
I also traded crude, yet profitable, trends. Historical patterns that I found would repeat themselves over and over again and could be traded again and again, usually for nice gains. The first trend I “learned” was the IPO spin-off trend. This was back in 1997-1998 and lots of companies were spinning off pieces of themselves to take advantage of the premiums the capital markets, at the time, seemed to be paying for dot-com IPOs, or anything technology related.
The 1st trade of this kind I did was when Data Broadcasting spun off CBS Marketwatch. DBCC (Data Broadcasting) stock basically doubled in a short period of time. I had the call options on the stock and made, at the time, a nice profit. What’s nice about tracking a trend, or any profitable trade, is seeing your theory play out and obviously reaping monetary gain. Sometimes, as any good trader knows, seeing a loser can be just as valuable in the long run, but anyone who is honest is going to enjoy making money rather than learning from their mistake(s)!
What was interesting about that trade/trend was that the opposite side of that trade almost, always would work, sometimes even for bigger profits. In fact, I had noticed that the “mother” stock, the stock spinning off the IPO, which in this case was DBCC, would TANK hard the day the IPO came. Why? Oldest trend in the books — Buy the rumor, sell the news!
I sold my calls and bought the puts and, if I recall, I doubled or tripled on BOTH sides of that trade. That, my trading friends, is a NICE Ka-chingo!
That trend was SOLID as a rock for a long time. My clients at Trendfund.com and I played that trend at least a dozen times on various stocks. I believe it worked every time except once. It didn’t work for Barnes and Noble spin-off of Barnes and Noble.com
(
BKS |
Quote |
Chart |
News |
PowerRating). From 2000 to 2003 that trend didn’t work much. Number one, there weren’t that many IPOs and, number two, the IPOs that did come weren’t usually met with the same frothy zest that the “dot-com bubble” had produced. Having said that, we did play Wendy’s spin-off of Tom Horton’s and made a VERY nice score on that. I had called that play on FOX News
(
FOX |
Quote |
Chart |
News |
PowerRating) and it paid huge dividends. But, all in all, that trend remains fairly dormant. There have been a couple of others since, but not much to speak of. While it’s a trend that I would still consider playing under the right circumstance, it’s not something I can count on consistently.
The same goes for the “SPLIT TREND” whereby stocks used to, and often still do, run up into a stock split. My clients had Joy Global Inc
(
JOYG |
Quote |
Chart |
News |
PowerRating) and Cleveland-Cliffs Inc
(
CLF |
Quote |
Chart |
News |
PowerRating) recently and made very nice money on both of those splits plays. But again, this is a trend that was a total gimme back in the go-go days of dot com yore! It still works, but it’s not something that you’ll get the 100 points we got on CMGI Inc
(
CMGI |
Quote |
Chart |
News |
PowerRating) and Qualcomm Inc
(
QCOM |
Quote |
Chart |
News |
PowerRating) way back when. Not likely.
There are very few trends that remain constants in my repertoire. Usually trends get discovered by the masses at some point and then it doesn’t work anymore, or it works sporadically. The January Effect Trend (which I’ll detail in a later article) is one such trend. It worked something like 19 of 20 years I had tracked it and then Maria (Bartiromo), yes, the Money Honey, started yakking about it on CNBC one year and all of a sudden it was done for. It’s still pretty powerful, and I’ll take my chances on it every year since the upside is tremendous and with proper money management the downside is pretty limited in most cases, but it doesn’t always work and it certainly doesn’t always work as well as it used to. It’s not a gimme-trend anymore.
There are many others we’ve tracked, and again I’ll detail many as we move forward in future articles, but one trend that is pretty much, knock on wood (yes, I am a superstitious trader, as many of my trader brethrens admit to being) still a gimme-trend is WINDOW DRESSING.
Window Dressing isn’t something I discovered, it’s something that most marketers and traders have known about for many years. The cool thing about WD is that unless there are no more Fund managers trading the markets, the trend should continue to be profitable if traded properly for a long time moving forward. As I explain the trend, it’ll become clear to those of you who have never traded it why that is.
Window Dressing is what it purports to be, is a trend whereby stocks get DRESSED UP into the end of each quarter (it happens on a monthly and sometimes on a weekly basis as well, but the gimme-trend is usually the quarterly WD). By dressed up, I mean that the stocks that have done well and outperformed leading up to the last week of the quarter get bought up by fund managers, hence often driving up share prices on these already outperforming stocks.
Why? Well, the simple explanation, and most obvious is that fund managers like to look smart. Looking smart, in theory, will attract other investors to their fund(s). So, if the Energy sector happened to be hot this quarter, which it was the most recent quarter ending June 30th of this year, then it only makes sense that fund managers would want to show how “smart” they are by stockpiling the best performing energy names out there. By the same reasoning, the worst performing stocks often get sold even harder into the end of the quarter because no fund manager wants to show the banking sector for the June 30th ending quarter, right? I mean, do you want to show you were foolish enough to hold Citigroup or Wachovia or MBIA throughout the carnage? Of course, not. You want to try to hide that little itty bitty “mistake” you made from potential clients.
Remember, investors are very fickle, most want the flavor of the day. If a fund owned the best of the best and avoided the worst of the worst then many investors will stick their money in those funds, regardless of whether or not the flavor of this week will remain the flavor of any future week. We know as traders that the market is constantly in a state of flux, but investors often don’t view it that way. I’m working on a piece about investor psychology (and trader) that should be up shortly. Regardless, that’s the basic trend to end the quarter.
Like most worthwhile trends, the flip side of the initial trend is often a trend in and of itself. For WD I’ve found over the years that just as the hot get hotter and the cold get colder into the end of the quarter, those very same stocks/sectors often reverse the first week to 10 days of the next quarter. Why? Again, fairly simple, fund managers may or may not have wanted the stocks they bid up, so they dump them at the inflated prices, and they may or may not have wanted to dump the cold stocks, worried they will eventually be right and thus they want to get back into many of the stocks they just dumped, or some new funds want to get in on the beaten down sectors at what they perceive are bargain prices. Either way, the trend often reverses the first week to 10 days of the new quarter.
This is what I call the Anti-Window Dressing trend. Maybe it’s the little kid in me, but I find these reverse/dual trends the most “fun” as a trader. It’s cool to make money both ways, when it works. Yes, I know, I’m such the TOOL! But hey, whatever makes money is fine by me!
Let’s look at a couple of examples for the quarter ending June 30th. Look at Goodrich Petrol Corp
(
GDP |
Quote |
Chart |
News |
PowerRating) and Energy Conversion Devices
(
ENER |
Quote |
Chart |
News |
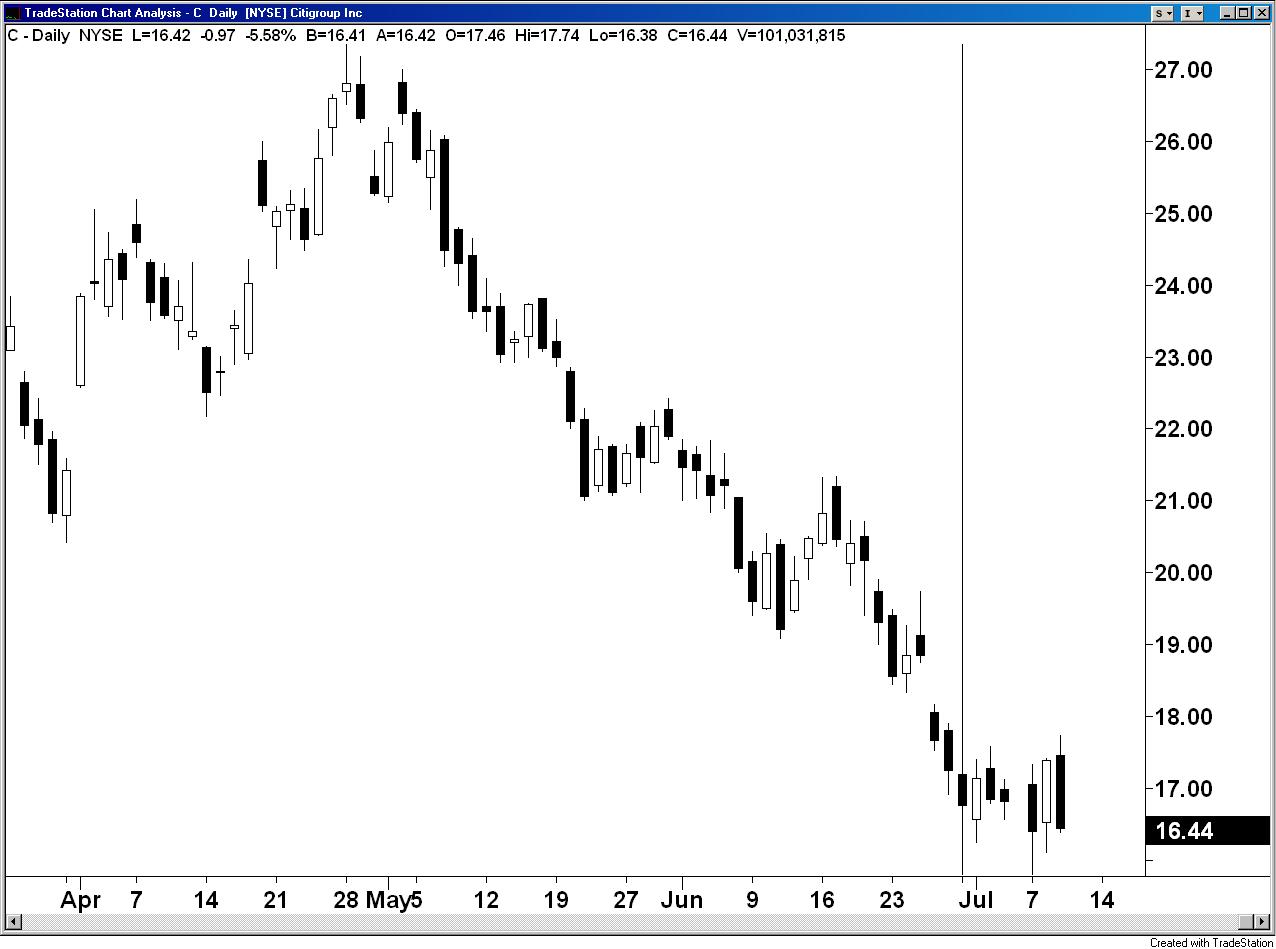
PowerRating). And, look at Citigroup
(
C |
Quote |
Chart |
News |
PowerRating).
Chart for GDP
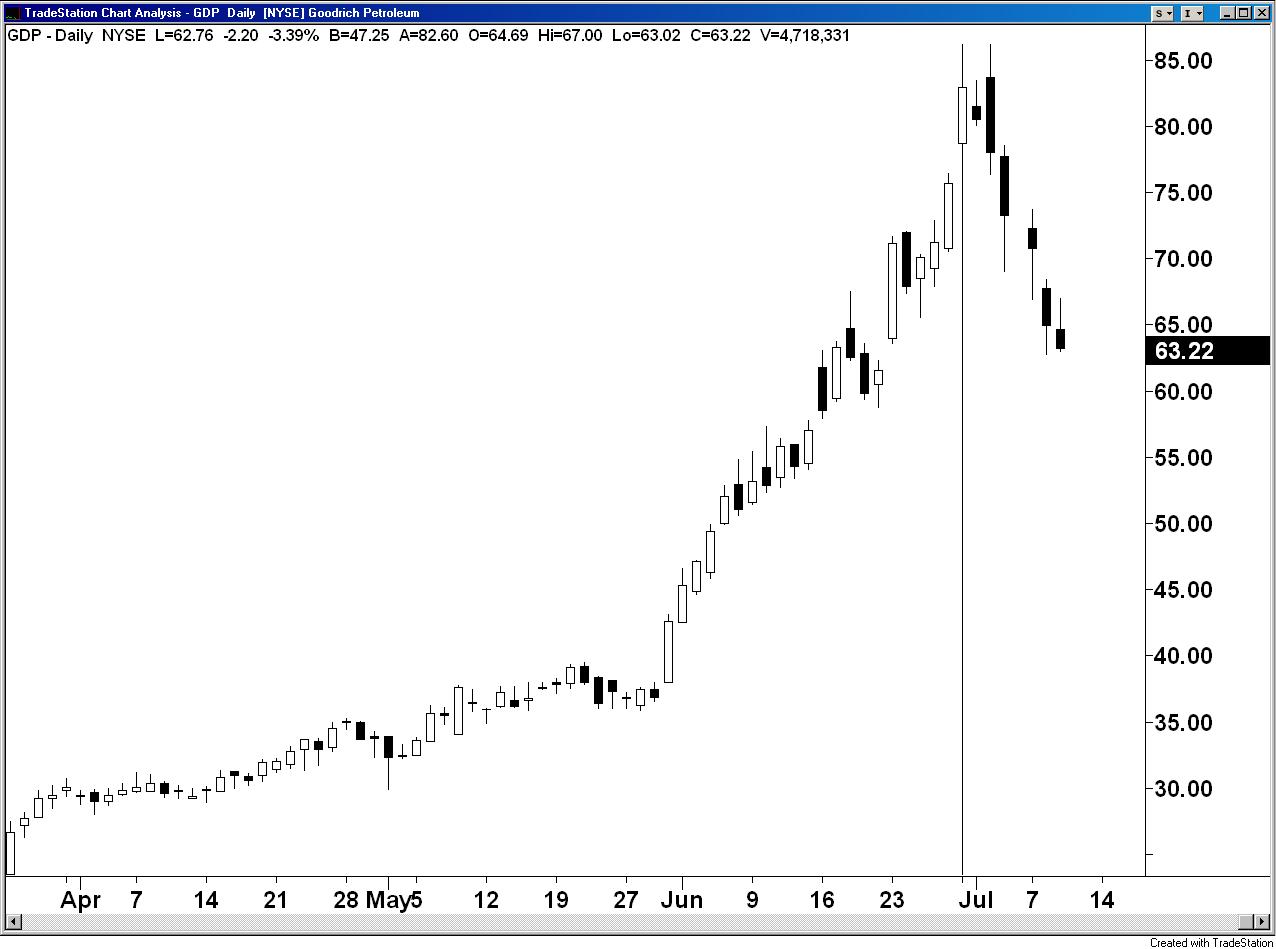
Chart for ENER
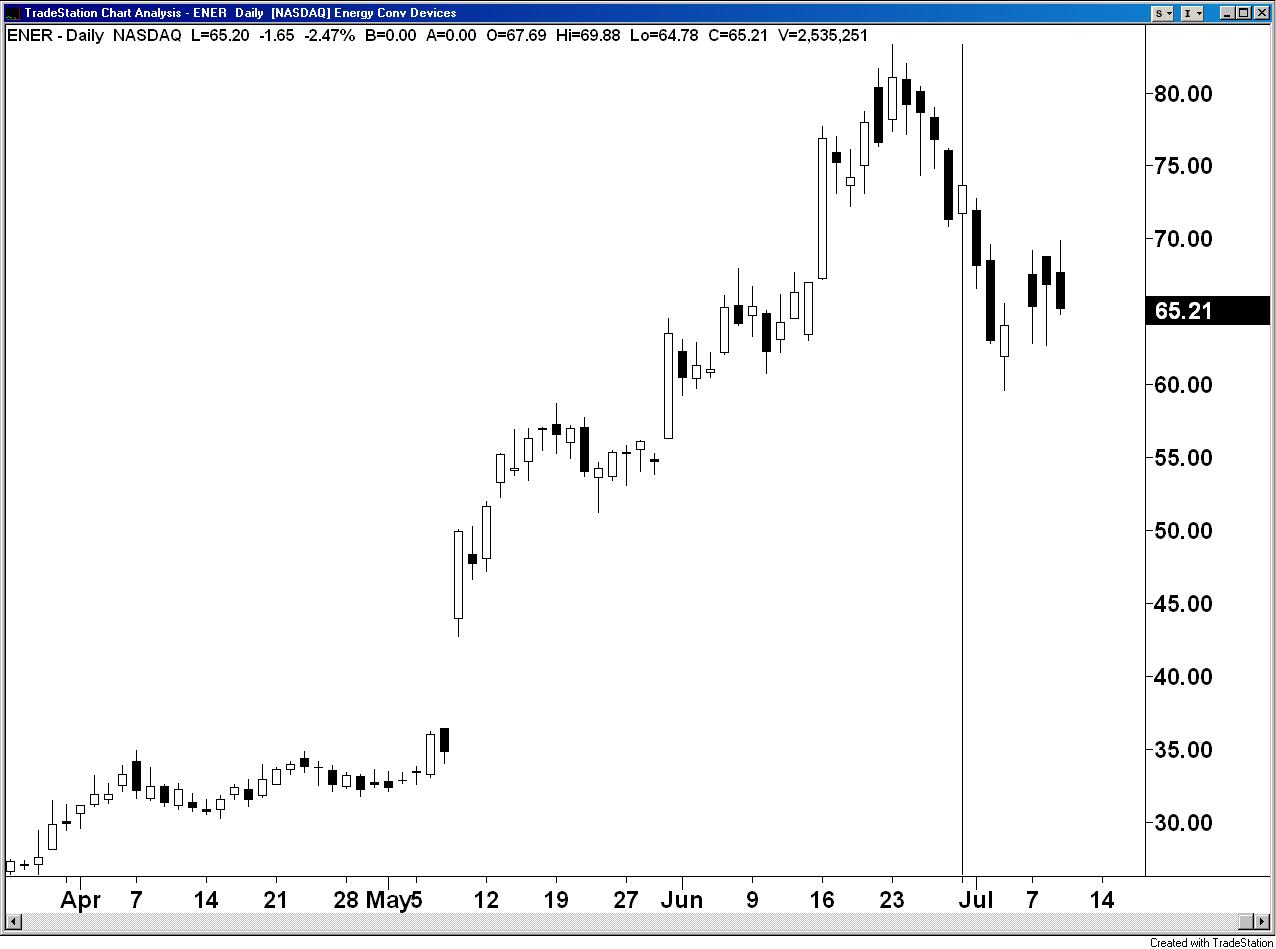
Chart for C
Notice how GDP ran into the last day of the quarter basically? I mean, that’s some kind of move! And, yes, my clients did have it! ENER didn’t quite move at the same velocity as the quarter came to a close, but clearly it was a beast!
I’ve found that you want to buy the trend the last 7 trading days of the quarter. It’s not always the same, but that’s a good average I’ve found over the years.
OK, so now look at C. As you can see, C got sold off sharply basically till the end of the quarter. But, here’s the run, notice how with GDP and ENER the stocks sold off almost violently to start the new quarter. Funds were so eager to bid them up to show how smart they are, but once the quarter ended, so did much of the passion to own them that moment. In fact, what often happens, and perhaps I’m just jaded but it’s happened far too often for my tastes to be a coincidence, but often times there is news that beats down the hot stocks or rallies the cold to start a new quarter. Often times the news comes in the form of upgrades by various 1st tier firms.
Look at US Steel
(
X |
Quote |
Chart |
News |
PowerRating), look at Joy Global. If we go back and look at other quarters we’ll find very similar market action.
OK, so which stocks to choose to play, because clearly that’s a key piece of this as a trader, I usually define with the following criteria;
A)The best sectors of the quarter B) The worst sectors of the quarter C)The best stocks in the hot sectors D)The worst stocks in the cold sectors E)Liquidity
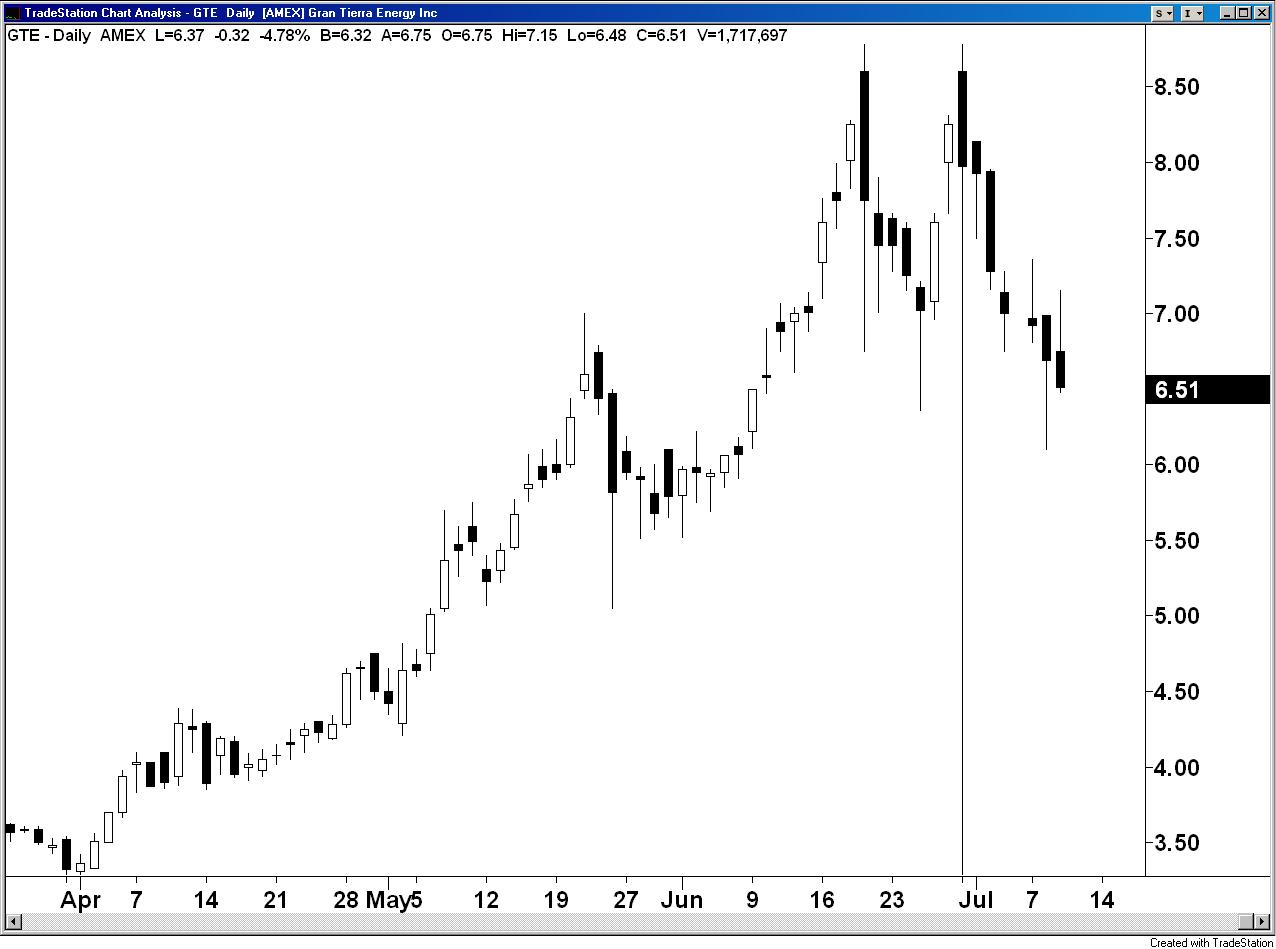
A through D is obvious. Liquidity isn’t. I like stocks like GDP and ENER, and we also played International Coal Group
(
ICO |
Quote |
Chart |
News |
PowerRating) and Gran Tierra Energy
(
GTE |
Quote |
Chart |
News |
PowerRating)
CHART OF ICO
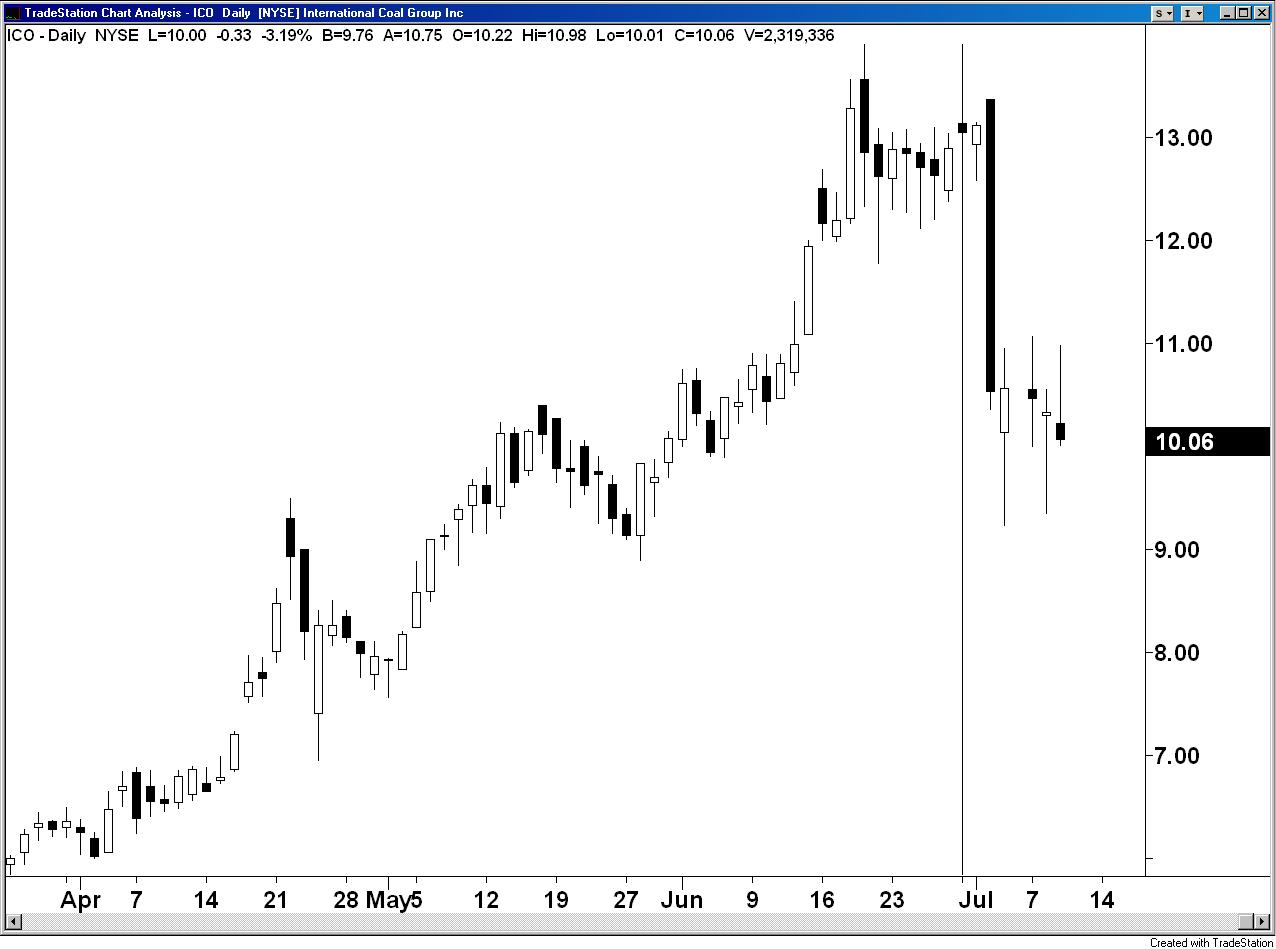
CHART OF GTE
I like to pick one or two small caps and I like the fact that ENER and GDP are optional and that they are relatively small market capped companies that are liquid, but thinly traded enough to really motor if/when any buying pressure starts to mount.
Also, I like the fact that ENER and GDP both have a “story” behind that and thus can easily be sold to clients of most funds as to the reasoning behind owning it in the manager’s fund.
Look at ICO and GTE post the quarter, the small cap stocks often make the best short candidates as well because they can pull back such huge %s at times. Again, I like the fact that ICO has put options for that play because of the buyout or news possibility that could smoke me as a trader if I merely short and hold it for a swing.
I like options a lot for this trend, for a lot of reasons. They are:
A) Quarters end and leave a lot of time value in the option due to the end of any month being either the 1st or 2nd week of a new options cycle B) The trend happens pretty fast often, therefore the time premiums usually stay pretty much intact regardless of “A” C) It lowers my risk and I get to maximize my profit potential D) It allows me to spread my portfolio capital around and not get bogged down tying up my entire port with longs and shorts that I am now stuck swinging for a week or so.
Michael Parness is a highly successful full-time master trader and CEO of the financial Web site trendfund.com. He is also the author of international best seller, Rule The Freakin’ Markets, Power Trading/Power Living, and the upcoming Rule Your Freakin’ Retirement (St. Martin’s Press). He’s appeared on CNBC, CNN FN, FOX News, and has been featured in WSJ, FT, NY Times, NY Post, Kipplingers and Crane’s.
He’s also co-founder of Full Glass Films and Full Glass Capital, a fund that bridge funds independent films. You can find Michael Parness’s work at https://trendtradingtowin.blogspot.com.
