Overloved and Overbought: 7 High-Flying Stocks for Traders
When the markets are up big before lunch time, all most traders can think about are stocks they will be buying when they get back to the office. But many traders, including many of the more savvy traders, are thinking more about the stocks they will sell.
It is axiomatic that there is a significant edge when it comes to trading in buying weakness and selling strength. But the fact that this is as close to a “golden rule” in trading as you’re likely to find doesn’t change the fact that actually doing this is surprisingly difficult. Precious few traders consistently have the courage to buy stocks that are moving lower (sometimes in a hurry) and the confidence to sell stocks when they are soaring and look like they will never come down.
This is one reason why so many traders choose trading systems that literally tell them when to buy, when to exit, when to sell short and when to cover. Whether or not traders completely automate their trading, or simply stick to a set of hard and fast rules, successful traders know that consistency in buying weakness and selling strength
— over time — is where the true trading edges lie, especially in the short term.
What sort of strength do traders want to sell? More than a few trading accounts have been blown up by traders trying to sell the wrong kind of strength. The kind of strength that traders look to sell or short is the temporary strength that weak stocks often display when the broader market is strong. Traders should not be in the habit of trying to wager against strong stocks that are flaunting their strength for all to see. Rather, traders should focus on those wannabe stocks, the weak stocks masquerading as strong stocks, as the object of their short selling.
How do we spot weak stocks? One of the best ways, in our opinion, is simply to use the 200-day moving average. Strong stocks are stocks that are consistently closing above their 200-day moving average.
Weak stocks are stocks that are consistently closing below their 200-day moving average. Again, this is from the perspective of the short-term stock trader.
And how do we spot temporary strength in these weak stocks? Our research has found that the old-fashioned Relative Strength Index (RSI)
— with a few key modifications — does an excellent job of spotting stocks that have risen to overbought extremes and maybe vulnerable to correction or outright reversal. The modifications
— discussed at length in this
article by TradingMarkets CEO Larry Connors and Editor-in-chief Ashton Dorkins
— include both shortening the RSI’s traditional time period from 14 to 2, as well as changing the overbought and oversold thresholds from 70 and 30 to 98 and 2.
As you may be able to tell from these improved parameters alone, our 2-period RSI is much more sensitive to short-term price changes, while at the same time being less sensitive to registering a market as overbought or oversold. As a consequence, we have produced an indicator that focuses on short-term prices, but alerts us only to truly exceptional instances of overbought or oversold extremes, rather than merely run-of-the-mill ones.
Below are seven stocks, all of which have 2-period RSI values of 98 or higher. I have ranked them in terms of both their PowerRating
— which serves as a general guide to the attractiveness (or lack thereof) of the given stock as a bet to the upside, with lower PowerRatings reflecting a less attractive stock. I have also listed the specific RSI values for each stock and included PowerRatings charts for traders to see graphically how these weak stocks are trying to trick traders into thinking they are something they are not
— namely strong stocks.
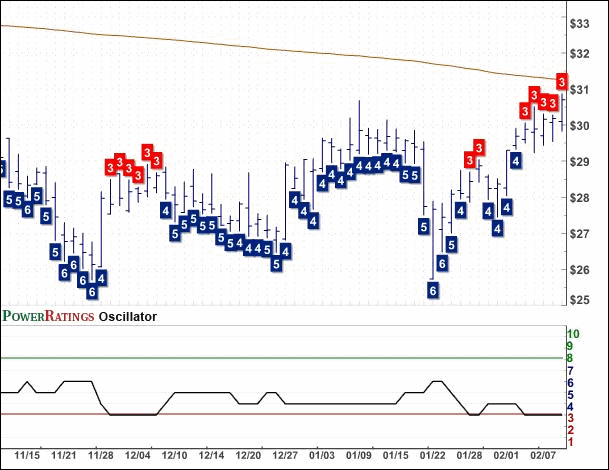
Kayne Anderson MLP Investment Company
(
KYN |
Quote |
Chart |
News |
PowerRating).
PowerRating 3. RSI(2) 99.60
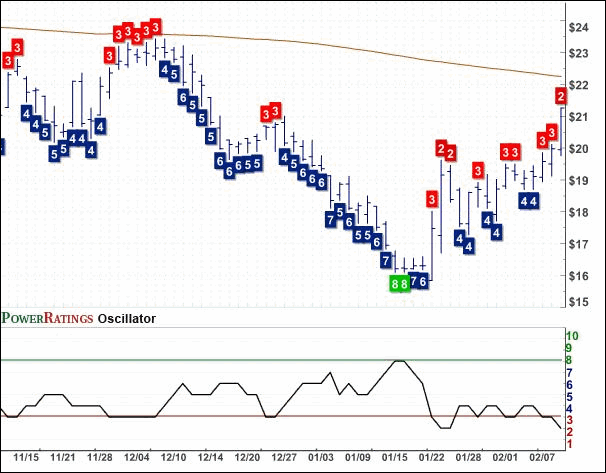
Carter Holdings Inc.
(
CRI |
Quote |
Chart |
News |
PowerRating). PowerRating 3.
RSI(2) 99.05
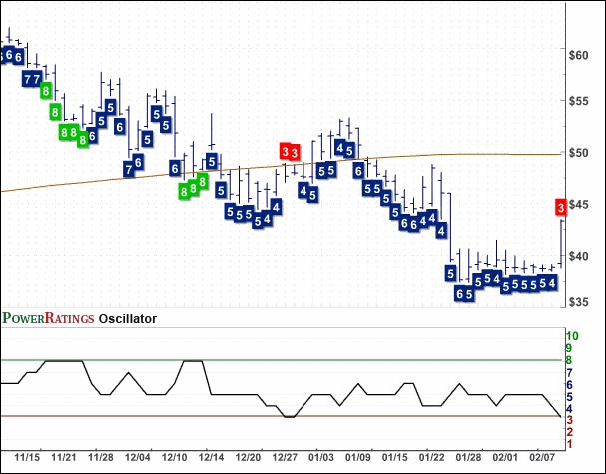
Arthrocare Corporation
(
ARTC |
Quote |
Chart |
News |
PowerRating). PowerRating 3. RSI(2) 98.87
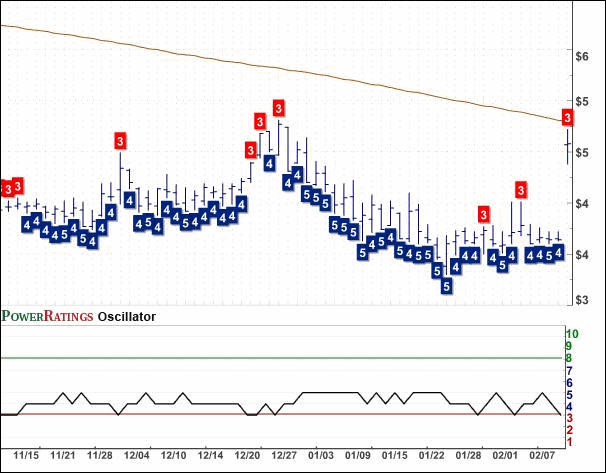
Axcelis Technologies Inc.
(
ACLS |
Quote |
Chart |
News |
PowerRating).
PowerRating 3. RSI(2) 98.26
Allegheny Technologies
(
ATI |
Quote |
Chart |
News |
PowerRating). PowerRating 2.
RSI(2) 98.14
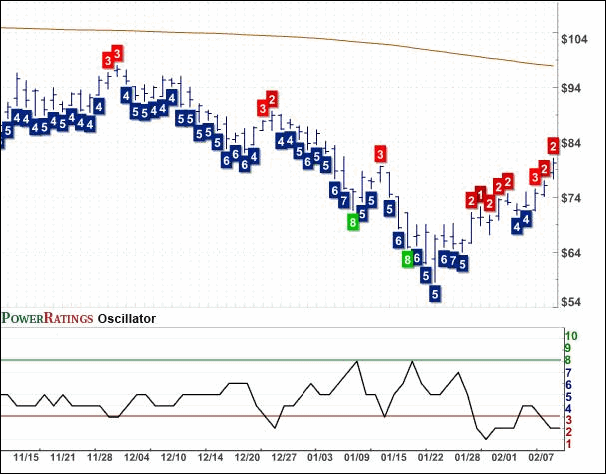
Jo-ann Stores Inc.
(
JAS |
Quote |
Chart |
News |
PowerRating). PowerRating 1.
RSI(2) 99.89
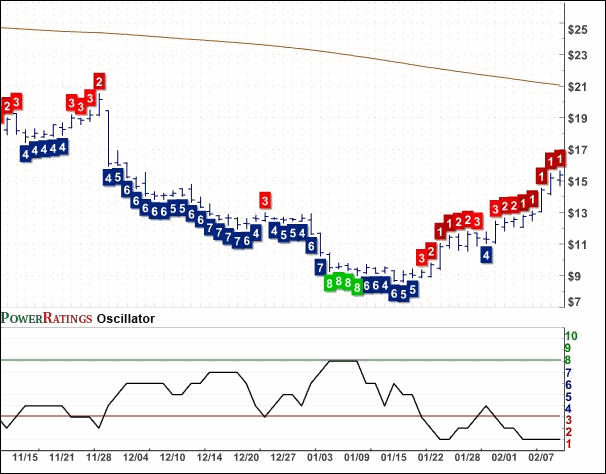
Sulphco Inc.
(
SUF |
Quote |
Chart |
News |
PowerRating). PowerRating 1. RSI(2) 99.10
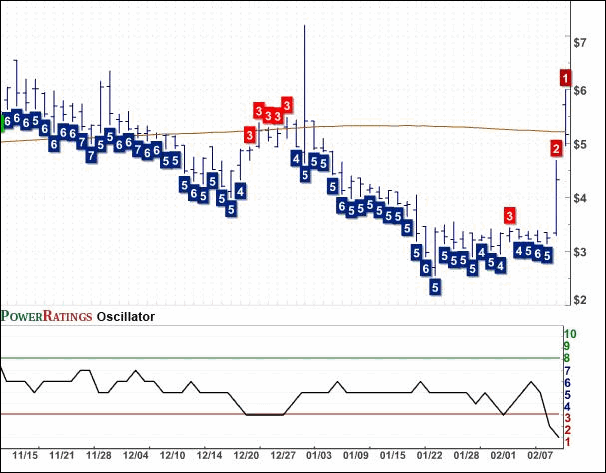
David Penn is Senior Editor at TradingMarkets.com
