A Simple Way to Trade E-mini Reversals
After trading equities and options for nine years and futures for seven, finding a few easy things that work each day is KEY to longevity in this business. And this was key to replacing my corporate America salary and finding something I loved to do at home. Trading in dry cleaning bills for pajamas and no daycare for my sons was a great incentive to learn to trade.
Click here to learn how to utilize Bollinger Bands with a quantified, structured approach to increase your trading edges and secure greater gains with Trading with Bollinger Bands® – A Quantified Guide.
When this trading journey started out for me I was a new Mom, and knew nothing (about trading or parenting). I taught myself to trade while rocking my son in a recliner and reading technical analysis books. Now nine years later my commute is about 150 feet. My sons come into my office each morning and wake up while climbing in my lap and tell me if they had any dreams, while I read pre-market news over their shoulder.
With that said, let s get started. I found the 13-minute chart to be a bit faster than the fifteen minute and slower than a five or three minute. PLUS it is a Fibonacci number so this makes sense in my trading, which is heavily based off fibs. Along with the 13-minute time frame, you will need Bollinger bands and volume. The settings to use on the Bollinger bands are also derived from fib numbers: 21 and 2. With those tools, add in candlesticks and you have the tools you will need to find intraday reversals with little risk.
When the market is moving in one direction and you are on the sidelines, it seems like you will never find an entry without chasing. I call this ‘waiting for the right bus while you sit at the stop,’ which is a huge challenge some days. I’ve begged the market and I’ve even yelled at it. I am pretty sure it can hear me if I stand and yell, but that will ruin your voice quickly and those around think you are insane. So it is best to be patient and let things setup. When the market has been in motion for a while the five minute and even lower time frame charts can catch you in the chop, and if the direction is steady you keep thinking it will pause and let you in. This will happen eventually, but how do you know which attempt to turn is the ONE for you. The trade setup below will help you identify that turnaround.
The criteria for the trade is simple: the market must be moving (trending) in one direction and if the direction is up, you will see plenty of light (white on my charts) candlesticks. You will also see the upper Bollinger move up and let price rise. Volume will be steady and increasing. The opposite is true for down movement–if we are moving down, the candlestick would be dark (red on my charts) and the Bollinger bands will open to the downside. As price nears the Bollinger band, you know things are slowing down, and then you look for a pause.
An inside bar is your pause. An inside bar is a bar that trades within the prior bar’s trading range. Along with this–and this is key–it has to be an inside bar of the opposite color of the trending direction on and lighter volume. Then a break of the inside bar in the counter direction to the prior trend. The last piece of terminology you should understand is ‘piercing of the Bollinger band.’ That simply means it touches the band (those pink lines on my charts below).
So let s break this down step-by-step with a few examples and logic:
Example #1
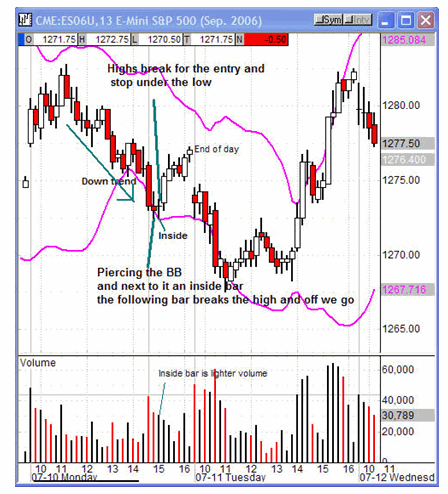
Price is moving lower, reaches the Bollinger band and pauses. There are other piercing and inside bars, but no inside bars to follow that break on the following bar. The high of the inside bar is 1273.75, buy that price and then trail the stop as it moves. I do that in one-point intervals. Half the position should be taken off at a one-point gain and pull the stop to the entry on the second half. With an initial stop-loss of 1.50, a tick under the low of the inside bar. Continue moving the stop as each point moves. The day closes at 1277, and that would be a trade that netted 3.25 – 4.25.

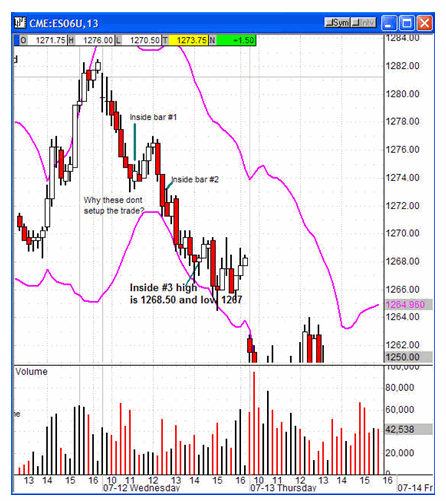
Why the first two inside bars are not within the criteria for the setup and #3 meets the criteria. Price is moving lower, that criteria is met for all three examples. Inside bar #1 is white and that is opposite the prior trend’s color, the following bar breaks it, BUT it is NOT at the Bollinger band–that is a deal breaker and is not a setup.
Inside bar #2 hits the Bollinger band but is NOT the opposite color, nor does the following bar break the high of it. This is NOT a setup.
Here’s a little tip: when you see these and it is NOT the opposite color, it is often a sign of more to come in that direction, which can be used as a guide if you are short or looking to get short.
Inside bar #3 Bollinger is pierced, the next bar is inside and opposite in color, with lighter volume and broken by the next bar to move us higher. Buy off the high of the inside bar, 1268.50, with a stop a tick off the low of the bar, 1267 (stop 1266.75). The price moved up to 1269.75 for a 1.25 reward. I take the 1 point move on half the position and trail the stop to entry. With the second half still in play, the price snaps back to the entry to stop us breakeven.

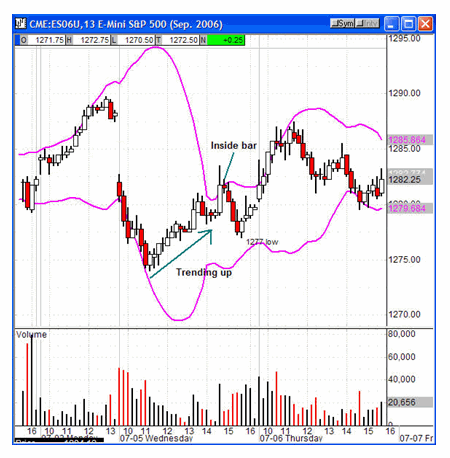
The market is trending up and a big white bar hits the Bollinger band; the next bar is the opposite color and inside on lower volume. The bar following the inside bar breaks to the downside and we fall. The inside bar low is 1281; the high is 1282.25. The entry short is at 1281, stop is 1282.50. Get half the position off at +1.00 and the stop is pulled to the entry. Trail the stop down to 1277 and stop out at 1278, with a move of each point increment, for a three-point maximum gain before the trailing stop is hit when it moved four points.

The hardest part of this trade is NOT over-analyzing it. Oscillators, fibs, moving averages — I use them for MANY setups. However, this setup is SIMPLE and plain yogurt with no toppings. Pull the trigger, get the trade on and ride the horse. This can net a small gain or a big one; you may even catch the big reversal of the day, but regardless the loss is limited and your gain is getting locked in after a one point move on the trade.
The day can bring several opportunities on this time frame — or just one a day. With the risk small and the criteria for the trade simple, adding this trade into your mixture will require very little time. Bollinger bands, a 13-minute chart, candlesticks and volume are the only tools needed to find this trade. I prefer setups you find on a regular basis versus those that setup every now and then and require you recite a book to remember the criteria. Sometimes, complex setups make this harder than it needs to be. Simple is good and removes mixed signals.
Teresa Appleton has traded equities and options for nine years and futures for seven. She founder and CEO of TradeLogic, LLC. For more information about Teresa and the training she offers stock, options and futures traders, click here.
