The SPX Extended Volatility Trade
Kevin Haggerty is a
full-time professional trader who was head of trading for Fidelity Capital
Markets for seven years. Would you like Kevin to alert you of opportunities in
stocks, the SPYs, QQQQs (and more) for the next day’s trading?
Click here for a free one-week trial to Kevin Haggerty’s Professional
Trading Service or call 888-484-8220 ext. 1.
In the last commentary for 3/11/08 I highlighted the obvious oversold condition, and that the major indexes were extended to their -2.0 STDV bands and beyond, on a one-year basis. The 6-day moving averages of the Volume Ratio
(ADV VOL/ADV VOL + DEC VOL) and breadth were extremely oversold at 30 and -995, and that a short term bounce was anticipated. I expected the $SPX 1/23/08 1270.05 magnet low to get taken out first on 3/11/08, as the
(
QQQQ |
Quote |
Chart |
News |
PowerRating), $COMPX, and IWM had already traded below their Jan 2008 lows, and the $SPX had closed Monday at 1273.37. I mentioned that the derivative meltdown and credit crisis would get worse as many hedge funds are shutting down because they
can’t meet the increasing margin requirements demanded by the banks, and there is no real liquidity in the mortgage derivative market, so hedge funds with these securities have no choice but to bail out. I said that
“there would be no short term fix for the derivative meltdown unless there is some grand solution that we certainly
don’t see yet.” Well, before the market opened on Tues (3/11) the Fed made an overt move in order to contain the derivative meltdown, and said it planned to make $200 billion available through the auction market, and would increase it if needed. The Fed said they would lend Treasuries in exchange for debt that includes mortgage-backed securities, and this was expected to relieve pressure in the credit markets and hopefully restore enough confidence
to the debt markets so that they would start to trade again.
Timing is everything as the $SPX was about to break below Jan 2008 lows based on the 3/10/08 close of 1273.37, so the Fed makes the
announcement before the 3/11 open, which of course was a huge gap up opening that trapped all of the shorts, and forced many money managers to chase the higher prices. I also told you that 3/11/08 was a longer term
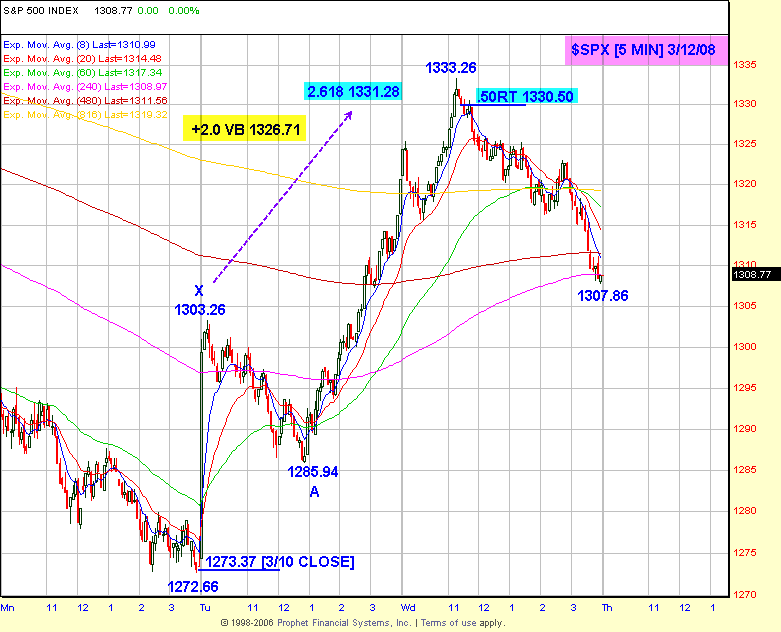
time date measured from the 769 10/10/02 bear market low, so it could be a catalyst. The $SPX finished the day +3.7% to 1320.65 from the previous 1273.37 close, for the biggest one day gain since 2002. However, the $SPX made a 1333.26 intraday high yesterday which is +4.8% from the 1272.66 low
(3/10) and then reversed down to a 1308.77 close (-0.9%).
In the trading service, the high probability price and time levels are always anticipated so traders can trade the plan, not emotion. Our traders caught the short move in the $SPX yesterday because of the anticipated extended volatility symmetry. The .50RT to the last significant high at 1388.34 from that 1272.66 low is 1330.50, and the 2.618 Fib extension of the XA leg
(1303.26-1285.94) is 1331.28. Also, 1333.26 is beyond the two day +2.0 Volatility Band from the 1273.37 previous close. The short entry was below the .50RT 1330.50 level
(futures, SPY, SDS) and the $SPX declined to a 1307.86 low. It was a high probability trade with excellent symmetry, and that is how you maintain an edge regardless of what the market does.
The stay on “Gilligans Island” didn’t last long as the $SPX futures are -20 points at 8:30AM ET so trading service members are ready to play a contra move strategy from extended Volatility Band levels.
The next commentary is Tues March 17.
Have a good trading day!
Kevin Haggerty
Check out Kevin’s strategies and more in
the
1st Hour Reversals Module,
Sequence Trading Module,
Trading With The Generals 2004 and the
1-2-3 Trading Module.
Have a good trading day,
Kevin Haggerty

