Month End and Time Symmetry
Kevin Haggerty is a full-time professional trader who was head of trading for Fidelity Capital Markets for seven years. Would you like Kevin to alert you of opportunities in
stocks, the SPYs, QQQQs (and more) for the next day’s trading? Click here for a free one-week trial to Kevin Haggerty’s Professional Trading Service or call 888-484-8220 ext. 1.
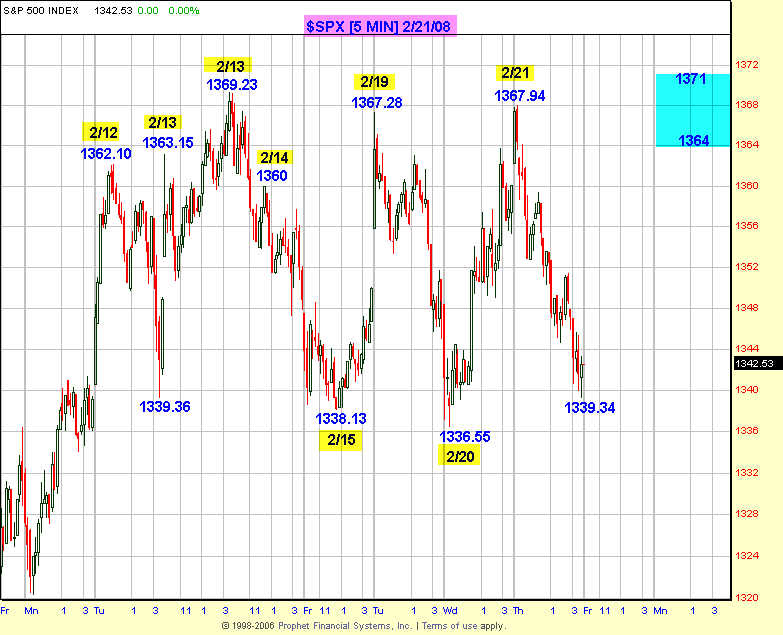
The energy and commodity related stocks led the $SPX to a -1.3% close at 1342.53, while the $INDU was -1.2%, and QQQQ -1.0%. NYSE volume was not heavy at 1.42 bill shs with the volume ratio 22 and breadth -1430 Crude oil ($WTIC) advanced +17% in 9 days and broke out of the 4 month trading range (100.09-85.42) hitting 100.86 on Wed and closing at 98.23 yesterday. Traders in the Service were on the USO trade at the bottom of the 79.09-68.30 four month range and it advanced +16.5% in the same period. It finished -2.5% yesterday at 77.33. At the 68.57 low Chavez rattled the oil sword, and he must have gotten long calls and then sold them on the reversal of the previous 79.09 range high yesterday, helped by the CNBC “empty suits” hype as they always do at highs and lows, because all they do is follow price and then provide a reason after the fact.
The market remains in a short term non-trending position, but with high intraday volatility as you can see on the $SPX chart. This has resulted in many strategy opportunities for daytraders using the RST and Trap Door, in conflunce with the one day volatility bands that we use in the service. The $SPX remains in the contracted volatility pattern, and the short term internals are neutral with the 4 day MA of the volume ratio at 47, and breadth -183. We need new levels for the next high probability position trading opportunity, and next week is month end, so maybe the Generals can get that done for us despite the negative scenario painted by the Fed on Wed. They emphasized all that has been obvious to most everyone except the CNBC “suits” which is slower growth because of the housing slump and credit crunch, in addition to higher unemployment and inflation. They dance around the questions about how the current derivative melt down is expected to play out for good reason I guess.
Next week has time symmetry in play from the 10/11/07-12/11/07 highs, and the 11/26/07-1/23/08 lows, so the $SPX contracted volatility pattern will be resolved. I have seen nothing yet to change my opinion that this bear market will not trade lower then 1270.
Have a good trading day!
Check out Kevin’s strategies and more in the 1st Hour Reversals Module, Sequence Trading Module, Trading With The Generals 2004 and the 1-2-3 Trading Module.

